C1
34,9%
Skin thermography and skin temperature
A founding program of the field, focused on thermal patterns, superficial physiology, and interpretation of skin temperature.
2.240 attributed articlesAn institutional reading of the field based on the scientometric study by Ribeiro and Giacomini, with combined Scopus and Web of Science data from 1980 to 2025.
Infrared thermography in health has moved from isolated applications to an internationally connected field, with accelerated growth, greater thematic diversity, and strong presence in diagnostic imaging, inflammation, perfusion, thermoregulation, and data science.
For Termodiagnose, this panorama organizes a central principle: thermal imaging only has value when treated as functional, measurable, protocol-dependent information, always correlated with clinical context and quantitative methods.
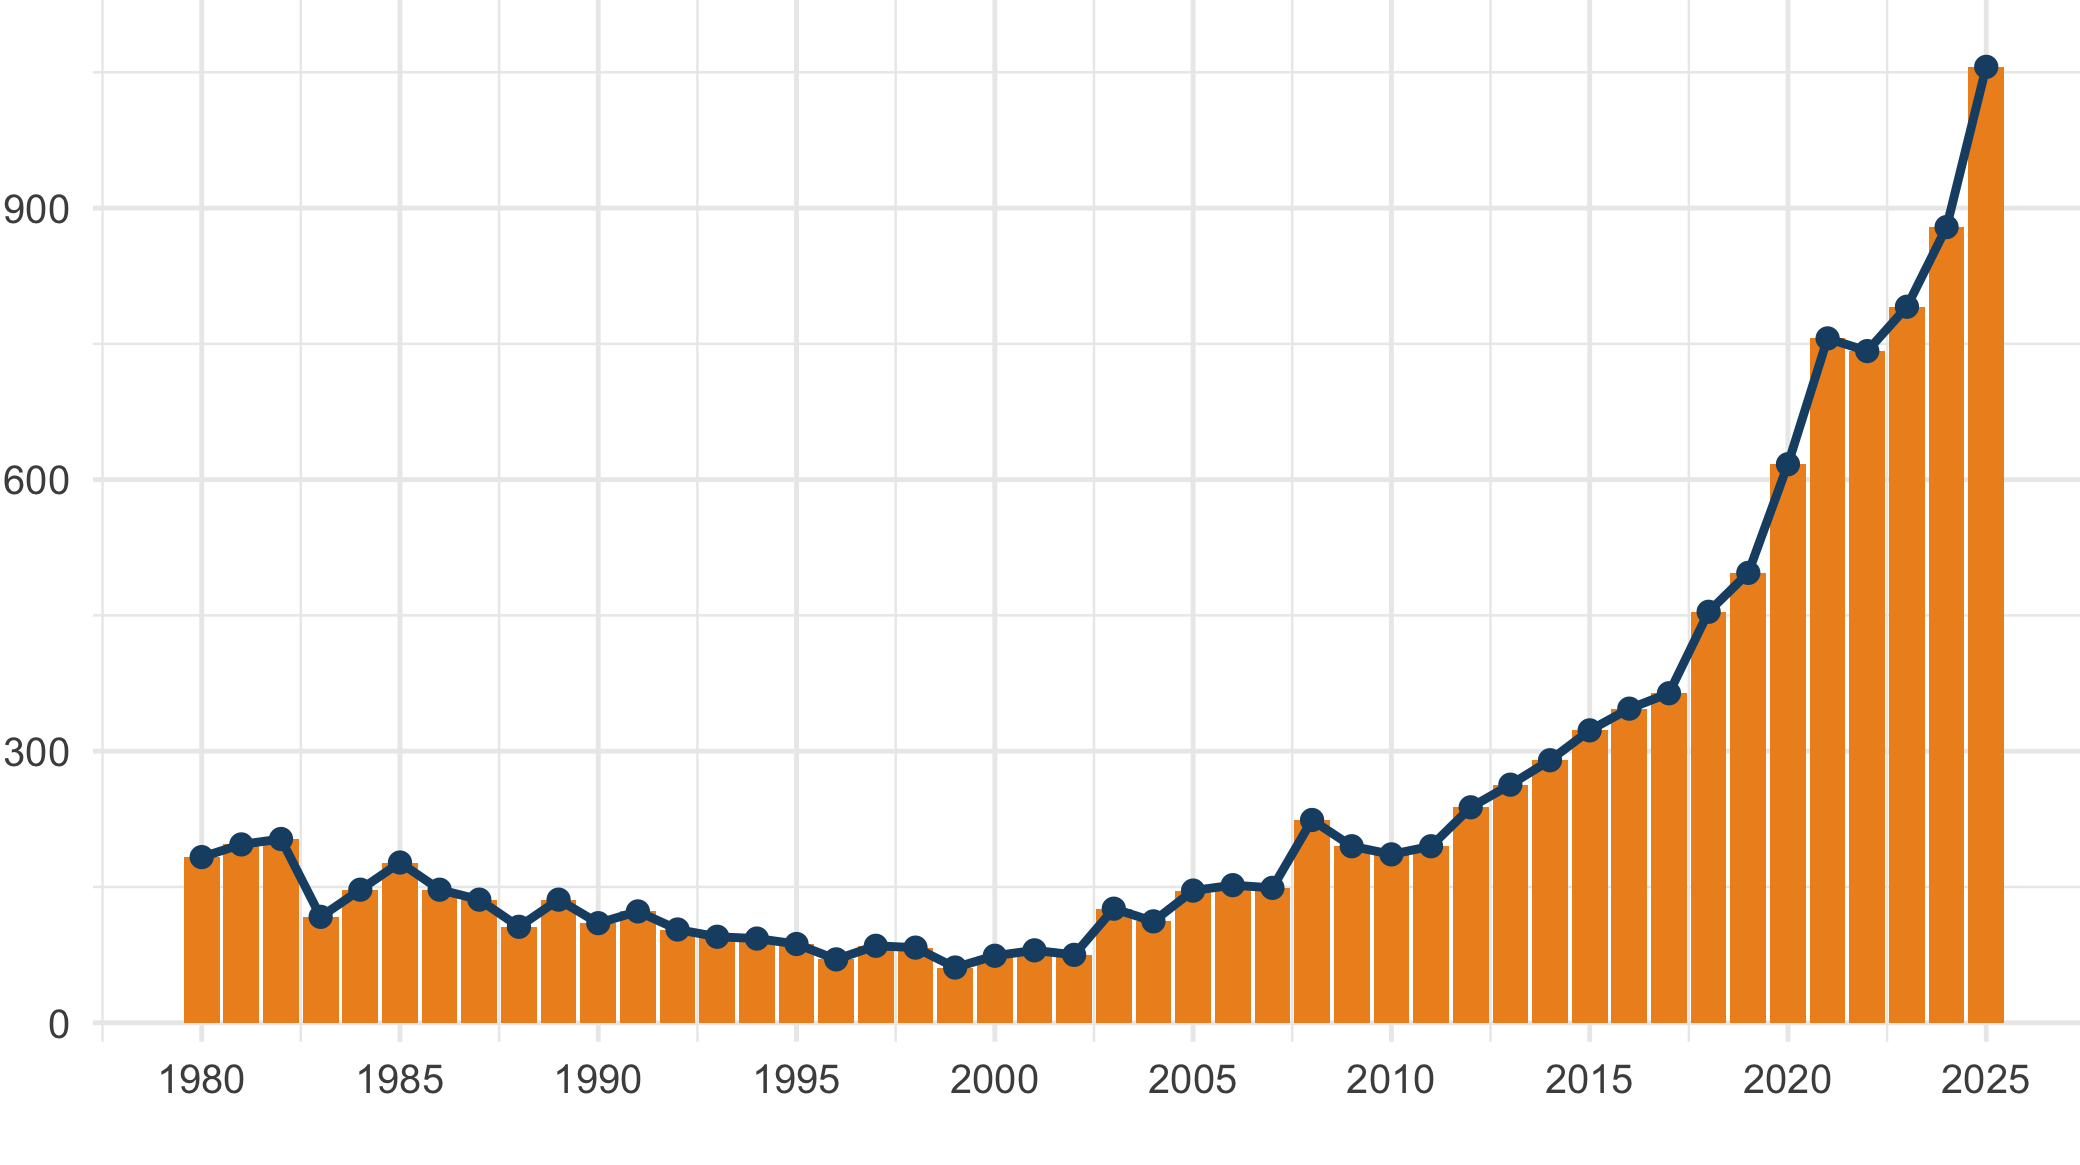
The annual publication volume shows a clear transition: after decades of relatively limited output, infrared thermography begins sustained growth, alongside advances in sensors, digital processing, artificial intelligence, and protocolized clinical applications.
Number of articles published per year in Scopus and Web of Science.
 Publication year
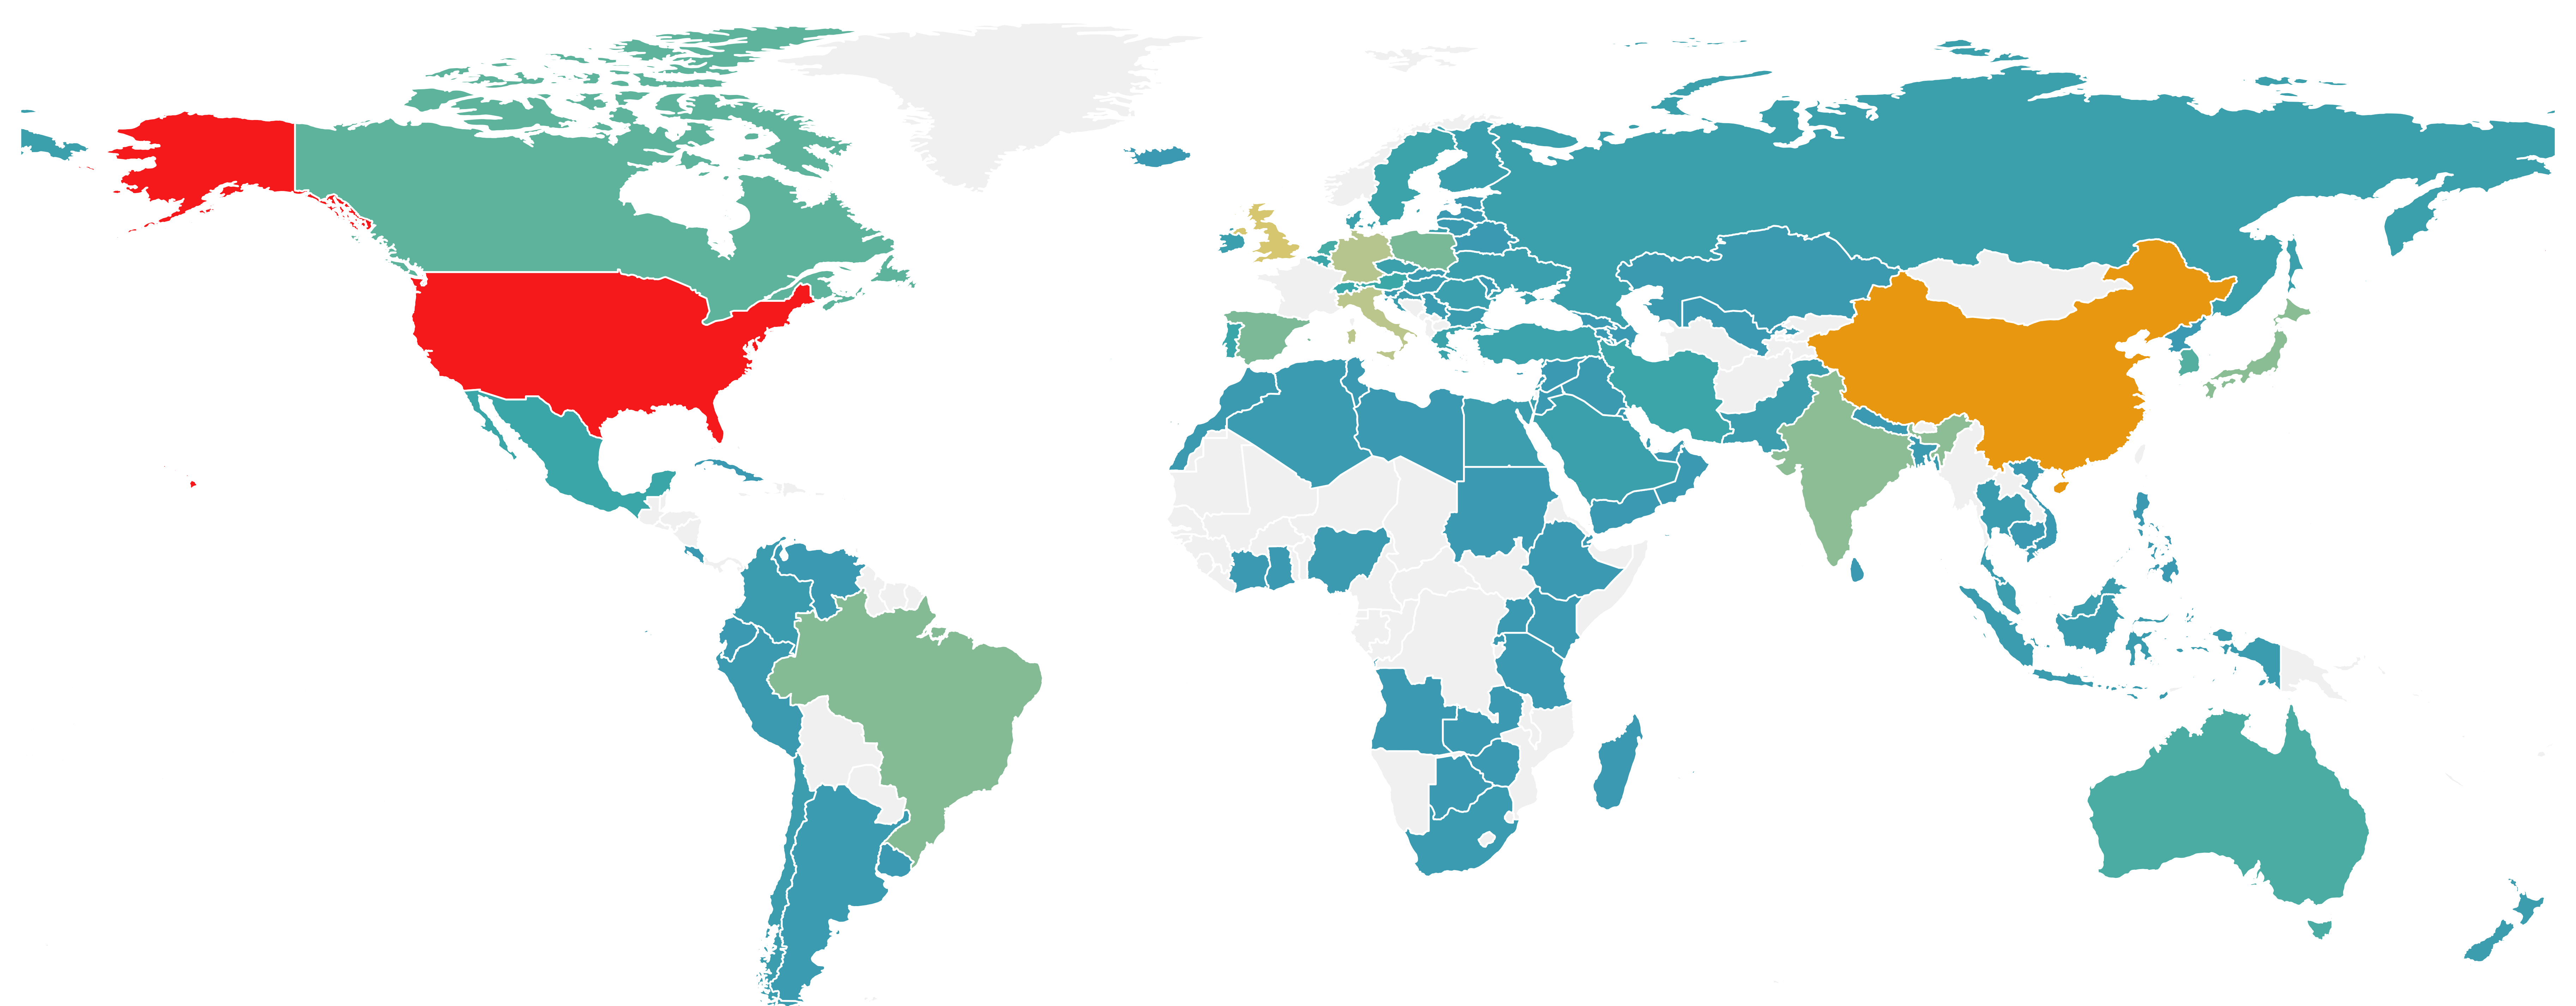
The map shows the international presence of the field and an asymmetric structure: the United States and China lead in volume, while European countries sustain dense collaboration networks and normalized impact.
Total number of articles published by country from 1980 to 2025.
 TERMOdiagnose Institute Brazil
In the full count of the study, Brazil ranks eighth in scientific production, with 508 attributed publications. This presence creates an institutional opportunity: connecting Brazilian production to international standards of protocol, quantitative analysis, and scientific collaboration.
| Country | Publications | Citations | MNCS |
|---|---|---|---|
| United States | 1.596 | 50.528 | 1,280 |
| China | 1.388 | 27.977 | 1,178 |
| Italy | 839 | 16.398 | 0,962 |
| Germany | 831 | 18.353 | 1,039 |
| United Kingdom | 667 | 23.051 | 1,329 |
| Japan | 550 | 11.558 | 0,799 |
| Spain | 522 | 12.618 | 1,121 |
| Brasil | 508 | 8.666 | 0,870 |
| France | 497 | 11.852 | 1,095 |
| India | 476 | 7.070 | 0,937 |
TP, TC, and MNCS according to Table 1 of the study. MNCS = mean normalized citation score by field and year.
Keyword communities show that thermography in health is not a loose collection of applications: there are recurring axes, specialized clinical themes, and emerging fronts linked to artificial intelligence.
A founding program of the field, focused on thermal patterns, superficial physiology, and interpretation of skin temperature.
2.240 attributed articlesAn expanding axis connecting thermography, computational methods, screening, classification, and artificial intelligence.
1.310 attributed articlesA component related to animal health and physiological monitoring, retained in the study because of the biomedical breadth of the search.
1.144 attributed articlesA community associated with thermal screening, infection surveillance, and population or clinical use of thermal measurements.
464 attributed articlesA set directly useful for discussing perfusion, tissue repair, local inflammation, and vascular response.
292 attributed articlesA more specific clinical theme linked to microcirculation, peripheral vascular changes, and autonomic response.
113 attributed articlesAt the end of the panorama, three fronts guide the Institute scientific work: chronic pain read through medical thermology, infrared thermography as a functional method, and data science applied to the thermal matrix. They are axes of expertise, not closed departments: they organize projects, co-mentorships, and collaborations with methodological maturity.
Persistent pain is studied as a clinical and functional phenomenon. Medical thermology adds an objective lens for observing surface thermal patterns related to autonomic function, microcirculation, sensitization, neuropathic or nociplastic components, and inflammatory response.
Thermography becomes a functional method when there is protocol, environmental control, standardized acquisition, radiometric analysis, and responsible clinical interpretation. The focus is to turn thermal imaging into measurable data.
The thermal matrix enables statistics, visualization, longitudinal comparison, and evidence building. This axis brings together thermography, scientometrics, quantitative analysis, and computational models applied to health.
Students, faculty members, and research groups may submit proposals related to chronic pain, medical thermology, infrared thermography, and health data analysis.
Learn about academic partnerships →Scientific source: Ribeiro, J. A. S.; Giacomini, L. A. Infrared thermography in biomedical and health-related research: a scientometric study based on Scopus and Web of Science (1980-2025). Quality & Quantity, 2026. DOI: 10.1007/s11135-026-02890-z.

The Termodiagnose Institute Brazil website was developed by Takotsubo Life Sciences, a Brazilian company dedicated to creating digital, scientific, and editorial solutions for health, research, and life sciences projects.