Scientific production

Scientific publications

A guided reading of published studies authored and coauthored by Termodiagnose, organized to explain method, clinical relevance, and scientific maturity in infrared thermography.

Featured article · 2026

How to turn occupational thermography into a protocol, not an isolated image.

In the study by Ribeiro and Giacomini, thermography is treated as functional data: a way to observe the body thermal response when there is technical control, a clinical question, and comparison with other findings.

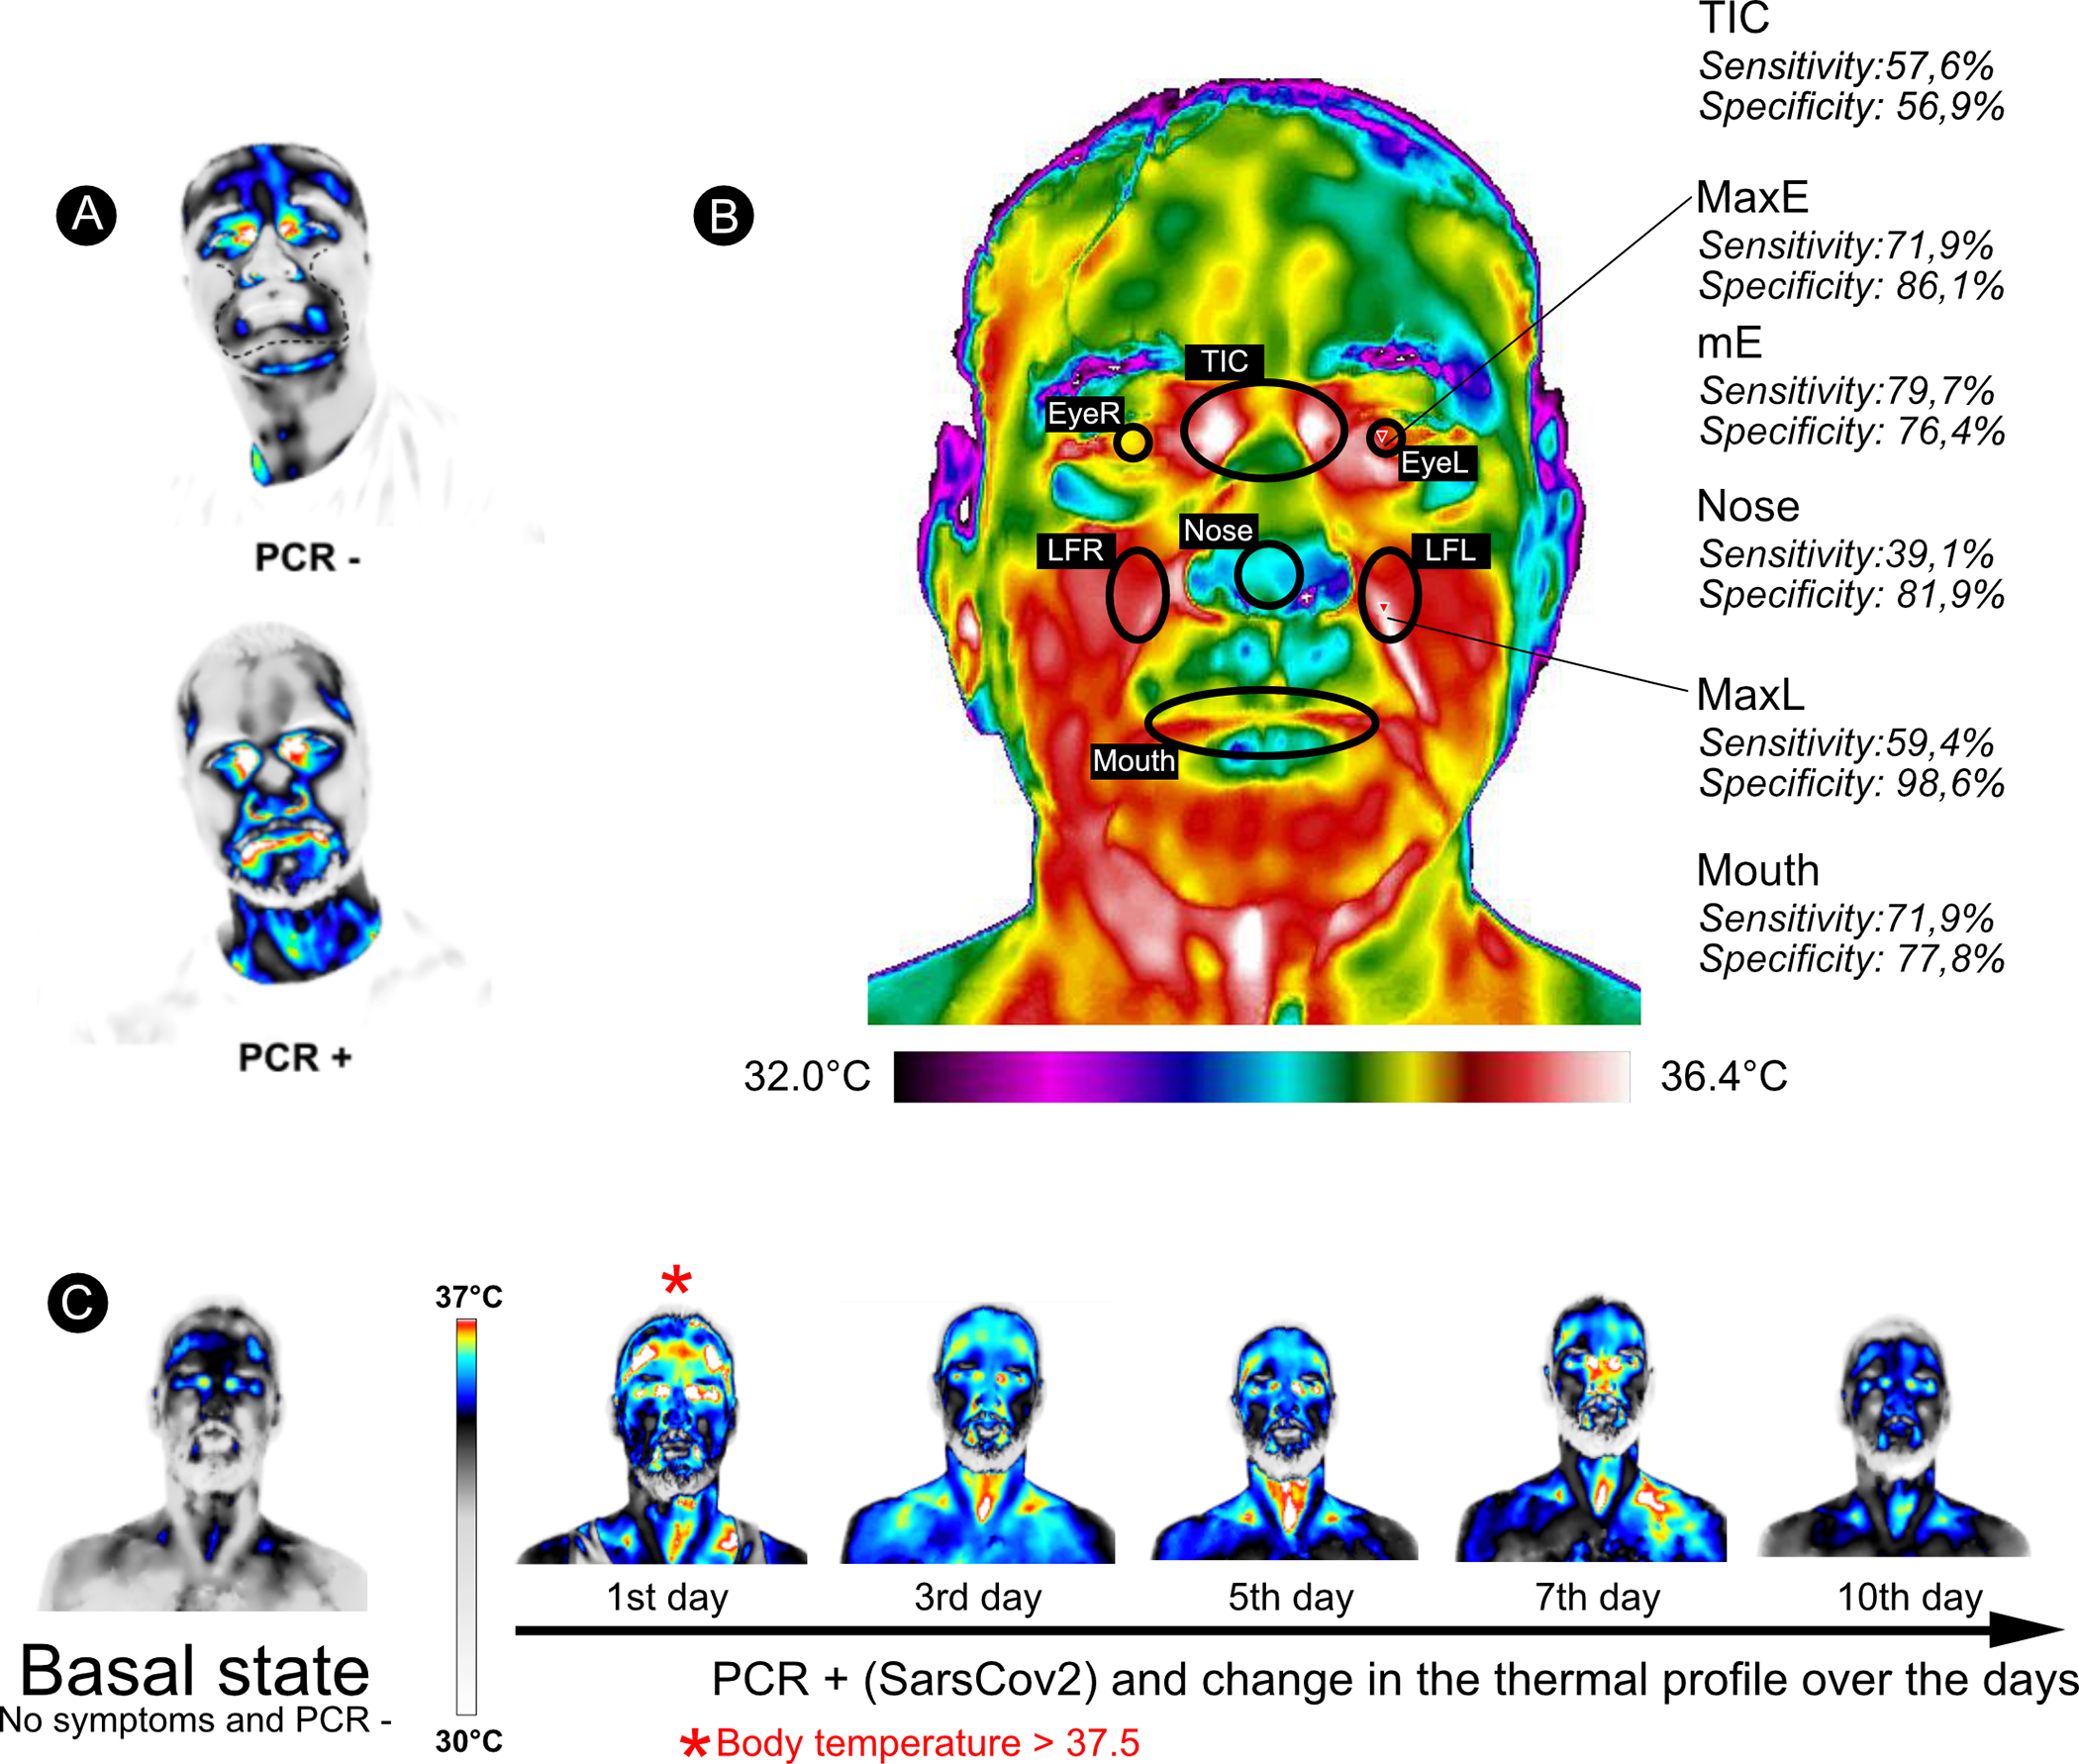
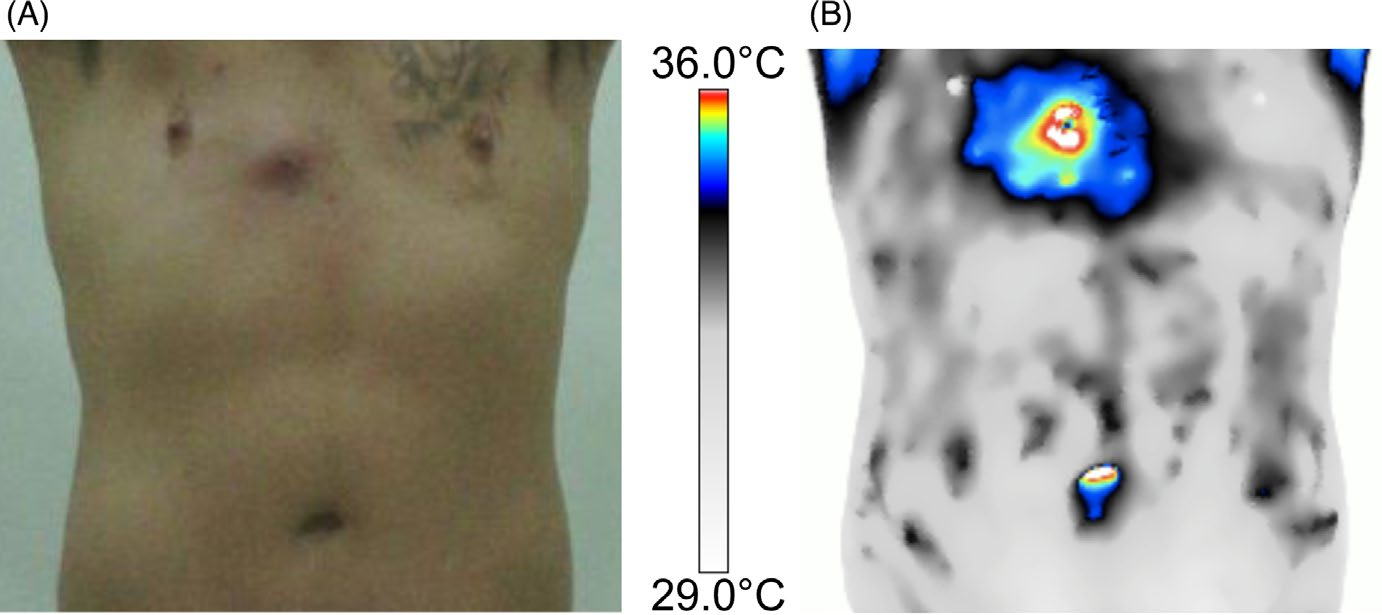
The starting point is concrete. Work-related musculoskeletal injuries and disorders remain major occupational health challenges. Often, the worker feels pain, fatigue, or loss of function before a structural change is evident. The review positions IRT as a complementary functional marker within a more complete occupational assessment.

Ribeiro J. A. S.; Giacomini L. A. Exploration of Musculoskeletal Diseases. 2026;4:1007122. DOI 10.37349/emd.2026.1007122
Aquisição termográfica ocupacional com câmera térmica, punho apoiado, dinamômetro e eletrodos de eletromiografia.
Occupational thermographic acquisition with wrist support, dynamometry, and surface electromyography.
Didactic reading

The study in four movements.

The article organizes the conditions in which thermography can generate useful information: a clear clinical question, technical control, comparison between regions, and integration with other assessment methods.

01

The clinical problem

Work-related musculoskeletal disorders may begin as subtle functional changes: pain, fatigue, asymmetry of use, and slow recovery after exertion. This does not always appear early in structural exams, and the isolated complaint may be insufficient to guide prevention.

02

What thermography adds

Infrared imaging observes heat exchange on the body surface. When the protocol is stable, this reading may function as a complementary physiological clue about microcirculation, autonomic control, thermal asymmetries, and response to exertion.

03

How the evidence was organized

The study gathered 247 papers and examined protocol quality, definition of regions of interest, thermal metrics, and integration with objective methods. The question was not “is the image beautiful?”, but “is the data reproducible and clinically interpretable?”.

04

The practical message

Thermography does not replace clinical examination, electroneuromyography, ultrasound, muscle strength, or pain scales. It gains value when it enters as a functional layer within multimodal reasoning.

What makes the data reliable

Standardization is what separates an interesting image from useful information.

The study makes clear that the value of IRT depends less on the visual impact of the thermal palette and more on the stability of the procedure. The image gains scientific strength only when environment, positioning, selection of regions of interest, and analysis are controlled.

Environment and preparation

Room control, acclimatization, distance, angle, emissivity, technical record, and repeatability before comparing images.

Regions of interest

Anatomical areas must be drawn consistently, because interpretation depends on comparing the same region over time.

Relative metrics

The focus is on bilateral asymmetry, variation after task, and recovery speed, rather than an isolated and decontextualized temperature.

Multimodal integration

IRT dialogues with sEMG, dynamometry, ultrasound, Doppler, patient-reported pain, and functional evolution.

At-risk population repetitive or static tasks
Brief clinical pre-screening symptoms and occupational history
Baseline IRT acquisition standardized bilateral views, if possible
Environmental standardization acclimatization for 15 minutes or more
Standardized stress task 10 to 15 minutes of typing or repetitive simulation
Post-task IRT acquisition same views and same scales
Multimodal integration EMG, dynamometry, VAS, and focal ultrasound, if indicated
Thermal analysis asymmetries, ΔT, and hot or cold patterns by segment
Risk stratification Actions
Low education and active breaks
Moderate ergonomic adjustment, training, breaks, and reassessment
High clinical referral, ultrasound when indicated, task modification, and rehabilitation plan
Standardized IRT follow-up to monitor response over weeks or months
Conceptual flow for screening and initial management of work-related musculoskeletal disorders, with IRT integrated with EMG, dynamometry, VAS, and patient-reported outcomes.
From the laboratory to real work

The protocol proposes a sequence, not a loose photograph.

First comes the baseline assessment. Then a standardized task or work-relevant exposure. New thermal acquisitions then show how the region responds and recovers. Interpretation becomes stronger when this pattern is compared with strength, muscle activity, perceived pain, and functional evolution.

Central message

Thermography can help reveal function, load, and recovery when integrated with clinical examination, strength, muscle activity, perceived pain, and functional evolution.

Clinical study · 2023 · PLOS ONE

When screening needs to see beyond fever.

In this study, facial thermography was tested in a real urgent-care setting: patients with influenza-like illness, comparison with RT-qPCR, and analysis of multiple thermal regions of the face.

The strength of the article lies precisely in its methodological question. Instead of reducing thermal screening to a temperature point, the study evaluated the facial profile as a set of signals: eyes, nasal region, mouth, difference patterns, and statistical performance against the reference standard.

Makino Antunes A. C.; Aldred A.; Tirado Moreno G. P.; Ribeiro J. A. S. et al. PLOS ONE. 2023;18(1):e0279930. DOI 10.1371/journal.pone.0279930
Scientific figure with facial thermal profiles, regions of interest, and thermal evolution of a patient assessed in the PLOS ONE study.
Figure from the article: facial thermal profile, regions of interest, and thermal evolution during the infection period.
136 patients assessed in urgent care
64 / 72 positive / negative RT-qPCR
86% accuracy of the model using multiple facial regions
MaxE highest predictive value among thermal parameters
Study reading

From facial imaging to diagnostic performance.

The study shows why the face should not be read as a single number. Inner canthus temperature, the mean between the eyes, and the lateral nose were more relevant than simplified thermal screening based on an isolated point.

01

The clinical question

In urgent care, respiratory symptoms may be nonspecific. During the pandemic, screening needed to separate risk, guide patient flow, and use resources quickly, even when fever alone did not explain the clinical picture.

02

The study design

The cross-sectional study evaluated adult patients with influenza-like illness seen at HU-USP and compared facial thermal parameters with RT-qPCR for SARS-CoV-2.

03

Thermal acquisition

Images were acquired in a controlled room with a thermal camera, with the patient seated 80 cm away, without a mask, during a 30-second facial radiometric sequence.

04

The central finding

The combination of facial regions performed better than the single-point logic. The eyes, the region between the eyes, and the lateral nose concentrated the best-performing parameters.

Translatable technical plate Facial thermal parameters
Entry patient with influenza-like illness in urgent care
Imaging standardized facial thermal acquisition
Reference comparison with clinical assessment and laboratory testing
Parameter Region Sens. Spec. Reading
TIC inner canthus of the eyes 57,6% 56,9% classic thermal parameter, with limited performance when used alone
MaxE highest ocular temperature 71,9% 86,1% best predictive value among the assessed parameters
mE thermal mean between the eyes 79,7% 76,4% sensitive marker of the periocular region
Nose nasal region 39,1% 81,9% higher specificity than sensitivity in the analyzed dataset
MaxL lateral nose 59,4% 98,6% parameter with high specificity
Mouth oral region 71,9% 77,8% contributes to the multiregional facial profile
86% accuracy of the combined model

Interpretive value increases when facial regions are analyzed together, with clinical and laboratory comparison.

Translatable matrix based on the article figure: facial parameters, sensitivity, specificity, and clinical interpretation.
Central message

The contribution of the study is to show that facial thermal screening can be analyzed as a multiregional physiological profile, not only as an isolated fever measure.

Case report · 2023 · Thermology International

When pain points away from where it hurts.

The report follows a patient who had lived for about five years with left testicular pain, progressive worsening throughout the day, and an anatomical investigation that did not explain the full clinical experience.

The article page is valuable because it shows the complete path: pain map, full-body thermal examination, inguinal and testicular asymmetries, thoracolumbar paravertebral focus, and a physical maneuver that reproduced scrotal pain.

Ribeiro J. A. S.; Aldred A.; Desuo I. C.; Gomes G. Thermology International. 2023;33(3):49-56.
Thermographic figure from the case report with left and right regions of interest in paravertebral topography.
Figure from the article: LEFT/RIGHT paravertebral ROIs and left hip topography on the same thermal plate.
65 years; chronic left testicular pain
39 thermal images in the full-body examination
90 neurovascular territories assessed bilaterally
0,36°C mean difference between left and right paravertebral ROIs
Clinical reading

The report turns a difficult complaint into a clinical pathway.

The interest of the case lies in the sequence. Pain was not treated as an isolated point, but as a bodily story: variable intensity, anatomical distribution, functional imaging, and immediate response to physical examination.

01

Pain that changed throughout the day

The patient reported left testicular pain radiating to the inguinal region and proximal medial thigh. In the morning it was tolerable; at night it could reach 9/10 and impair sleep.

02

A diagnostic path without a full answer

Ultrasound, computed tomography, magnetic resonance imaging, and urologic and orthopedic assessments formed an extensive history, but were still insufficient to explain the pattern experienced by the patient.

03

The image reorganized the clinical view

The full-body thermal examination searched for asymmetries in neurovascular territories, including inguinal regions, testicular topography, proximal thighs, and paravertebral topography.

04

The turning point came during the physical examination

Compression of the left paravertebral area indicated by the image reproduced scrotal pain and a pulling sensation in the proximal medial thigh; on the other side, the stimulus produced no symptoms.

Case atlas

From the patient’s history to the paravertebral clue.

The article figures help follow the reasoning: first the pain distribution, then the thermal asymmetries, and finally the objective comparison between sides.

Figure 4 Pain map completed by the patient in the chronic testicular pain case report.
Pain map The report begins with the distribution of pain: testicle, inguinal region, lower back, flank, and pathway in the left lower limb.
Figure 1 Thermogram showing asymmetry between inguinal regions and drawn regions of interest.
Inguinal asymmetry The left inguinal region appears less radiant, in a topography related to the iliohypogastric and genitofemoral nerves and the L1 dermatome.
Figure 2 Thermogram of proximal thighs and testicular topography showing bilateral thermal difference.
Medial thigh and testicular topography The proximal medial thighs and testicular topography show bilateral asymmetries with ΔTavg of 0.4 °C.
Figure 3 Posterior thermogram with highlighted left paravertebral thoracolumbar focus.
Thoracolumbar focus The posterior thermogram shows a left paravertebral hot spot, without evident contralateral correspondence.
Figure 5 Definition of left and right regions of interest in paravertebral thermographic asymmetry.
Paravertebral ROIs The LEFT and RIGHT regions were drawn over the suspected asymmetry, preserving side-by-side comparison in the thermal matrix.
Figure 6 Temperature distribution chart between left and right paravertebral sides.
Thermal distribution Each ROI had 468 measurements. The comparison showed a mean difference of 0.36 °C between the paravertebral sides.
Clinical sequence A hypothesis built step by step.
2008 radical prostatectomy for prostate cancer, with subsequent follow-up
2018 onset of left testicular pain radiating to the inguinal region, medial thigh, and flank
2021 orthopedic and urologic evaluation without sufficient etiology for the pain syndrome
2022 full-body thermography in the pain medicine investigation
less radiant left inguinal region ΔTavg 0,4°C

topography related to the iliohypogastric and genitofemoral nerves, also close to the L1 dermatome

proximal medial thigh and testicular topography ΔTavg 0,4°C

apparent asymmetry between proximal medial thigh regions and between testicular topographies

left thoracolumbar paravertebral hot spot 26 × 18 px

symmetric ROIs with 468 measurements each, extracted from the thermal matrix for statistical comparison

statistical difference between ROIs p = 2e-16

Wilcoxon indicated a significant difference between the left and right regions, with ΔTavg of 0.36°C

Turning point

Compression of the left paravertebral area indicated by the image reproduced scrotal pain and a pulling sensation in the proximal medial thigh. Contralateral compression did not trigger symptoms.

Central message

In this report, thermography gains value by bringing together image, neural territory, and physical examination. The result is a more organized clinical hypothesis for a painful condition that had remained without a satisfactory answer.

Publication 04 · 2022 · Journal of Cosmetic Dermatology

The skin also writes its history in temperature.

This review brings thermography closer to everyday dermatology: inflammation, burns, nail changes, panniculopathy, laser, cryolipolysis, and aesthetic procedures can be followed through changes on the thermal surface of the skin.

The editorial value of the study lies in showing that thermal imaging is not merely a colored image. It can record the extent, intensity, and evolution of cutaneous phenomena when the protocol is well controlled and interpretation remains linked to the clinical examination.

Vergilio M. M.; Gomes G.; Aiello L. M.; Fontana M.; Aldred A.; Ribeiro J. A. S. et al. Journal of Cosmetic Dermatology. 2022. DOI: 10.1111/jocd.14748.
Facial thermal image before and after laser application in an aesthetic treatment.
Figure from the article: facial thermal monitoring before and after three minutes of laser application in an aesthetic procedure.
Review article on clinical dermatology and aesthetic applications
8 application axes organized in the study
4 clinical figures illustrating uses of thermal imaging
contactless surface monitoring without ionizing radiation
Editorial reading

Science becomes closer when it shows what changes in the skin.

The skin is visible, but not everything that matters appears as color, relief, or texture. Thermography adds a functional layer: where there is inflammation, flow, stasis, cooling, or treatment-induced heating.

01

The skin as a thermal interface

The skin translates circulation, inflammation, barrier function, and response to stimuli. Thermography turns this surface into a measurable map without touching the patient.

02

From visible lesion to functional data

The article shows that photography documents appearance, while thermal imaging reveals the extent, intensity, and heat distribution that may not be evident to the naked eye.

03

Follow-up over time

Repeated measurements make it possible to observe the evolution of inflammation, response to treatments, and thermal recovery after dermatologic or aesthetic procedures.

04

Procedural safety

In lasers, radiofrequency, cryolipolysis, and other interventions, surface temperature can guide energy limits and reduce the risk of thermal injury.

Skin atlas

Four images, four ways to see the same principle.

The figures from the article make the review concrete: inflammation, thermal relief, peripheral extent, and response to a procedure appear as measurable patterns.

Figure 1 Clinical and thermal image of a cutaneous abscess in the thoracic region.
Cutaneous inflammation The comparison between ordinary image and thermogram shows how local inflammation increases heat dissipation and delimits the active area.
Figure 2 Thermal image of gynoid panniculopathy in the gluteal region.
Panniculopathy and thermal relief Thermal irregularity helps visualize hot and cold areas linked to microcirculation, edema, and local stasis.
Figure 3 Clinical and thermal image of an inflammatory process in the hallux.
Nail and peripheral inflammation The painful nail appears as a process spreading over the surface of the toe and foot, revealing the functional extent of inflammation.
Figure 4 Facial thermal image before and after laser application in an aesthetic treatment.
Facial laser procedure The thermal before-and-after shows why heat monitoring matters in aesthetics: efficacy and safety depend on dose, time, and tissue response.
Where the review opens pathways

From inflammatory disease to aesthetic procedure, the method is the same: measure in order to follow.

Inflammatory dermatology

Psoriasis, hidradenitis, acne, and dermatitis may alter local temperature through vasodilation, inflammatory activity, and microcirculatory change.

Scleroderma and vascularization

In localized and systemic scleroderma, thermal imaging appears as support for inflammatory activity, asymmetry, and vascular phenomena.

Burns and healing

The reviewed literature addresses burn depth, healing potential, and clinical decisions about follow-up or intervention.

Cosmetology and aesthetics

Cellulite, cryolipolysis, radiofrequency, laser, and body-contouring massage can be documented through thermal changes before, during, and after.

Nails and hair

The study also brings thermography closer to onychomycosis, inflamed nail, and frontal fibrosing alopecia when there is a measurable inflammatory component.

Pharmacological research

Dermatologic and cosmetic products gain an additional parameter: the skin surface can be measured serially and comparably.

Central message

In dermatology, thermography brings science and care closer because it turns the skin into a surface for follow-up: more objective than isolated visual impression, and more human when it helps show the patient that treatment is being observed with method.

Institutional editorial

Medical thermology: turning heat into method, and method into evidence.

Termodiagnose Institute Brazil was created with a technical ambition: to foster the development of medical thermography and thermology in health on solid methodological foundations, with enough scientific culture to bring research, clinical practice, and translational validation closer together.

Medical thermology does not advance when treated as a quick promise. It advances when it recognizes its own complexity: the body emits heat, but the clinical meaning of that heat depends on physiology, environment, calibration, comparison, context, and well-formulated questions.

How methods mature

No imaging test was born ready to be accepted.

The history of radiology and ultrasound shows that new images pass through enthusiasm, resistance, standardization, training, safety, comparison with established methods, and only then mature clinical integration.

1895 onward

Radiology

Radiography opened a new visual culture in medicine, but its path required technical standardization, specialized reading, radiological protection, and decades of clinical consolidation.

1950–1970

Ultrasonography

Ultrasound moved from an experimental field into clinical routine when transducers, protocols, training, and anatomical correlation made the image reproducible.

1950–2000

Clinical thermography

Thermography gained early interest, but encountered resistance because it strongly depends on environment, calibration, skin physiology, and still unstable interpretation criteria.

2020 onward

Quantitative thermology

Radiometric cameras, computational analysis, serial studies, and artificial intelligence reopened the field with another question: how can heat be transformed into reliable clinical data?

Hyperrealistic editorial scene comparing old radiographic equipment with a modern digital radiography room.
Radiography From developed film to digital imaging. Radiology also had to move through equipment, safety, film processing, standardization, and specialized reading before becoming clinical routine.
Hyperrealistic editorial scene showing the evolution of ultrasonography with B-mode, Doppler, elastography, and 3D obstetric imaging.
Ultrasonography From B-mode to functional and volumetric imaging. Ultrasound expanded its technical language: grayscale, Doppler, power Doppler, elastography, and 3D/4D show that a method matures when it learns to answer different questions.
Anatomical imaging

See structure

Radiography, computed tomography, magnetic resonance imaging, and ultrasound answer questions about shape, tissue, lesion, mass, fracture, thickness, deep flow, and anatomical relationship.

Thermal functional imaging

Read behavior

Thermology observes patterns of thermal emission that may reflect superficial perfusion, inflammation, autonomic response, asymmetry, recovery, and temporal variation.

The point is not to compete.

The thermological question is different from the anatomical question. When well indicated, it can complement structural examinations by documenting function, dynamics, and physiological response.

Interpretive models

Complexity is not an obstacle: it is the reason method must exist.

The most promising current models do not depend on an isolated image. They combine standardized acquisition, quantitative analysis, physiological comparison, and validation against clinical outcomes.

Controlled acquisition

Room conditions, acclimatization, emissivity, distance, framing, thermal scale, and technical documentation stop being details and become part of the examination.

Asymmetry and ROIs

Reading does not depend on an isolated temperature, but on regions of interest, bilateral comparison, pixel distribution, and anatomic-functional coherence.

Dynamic models

Thermal challenges, exertion, rewarming, cooling, functional testing, and temporal curve monitoring bring thermology closer to real physiological phenomena.

Multimodal integration

Thermology gains strength when it dialogues with clinical examination, ultrasound, Doppler, magnetic resonance imaging, electroneuromyography, laboratory data, and patient evolution.

Computational analysis

Computer vision and AI can organize patterns, but they need auditable data, clinical endpoints, and external validation before supporting decisions.

Clinical translation

The final goal is not to produce impressive images, but better questions, testable hypotheses, and functional indicators that are useful for care.

Institute objective

To build a bridge between thermal data science and responsible clinical decision-making.

The commitment of Termodiagnose Institute Brazil is to help medical thermology develop as a serious technique: teachable, auditable, comparable, and open to validation. This means producing protocols, training interpreters, encouraging translational clinical studies, and defending that every indication be supported by evidence, not enthusiasm.

Not replace

Radiography, computed tomography, magnetic resonance imaging, and ultrasound remain essential for structure, shape, anatomical lesion, and therapeutic guidance.

Complement

Thermology occupies another place: studying thermal function, superficial perfusion, autonomic response, inflammation, symmetry, and temporal evolution.

Validate

Each application needs to demonstrate reproducibility, accuracy, clinical relevance, and interpretive limits before being treated as a diagnostic model.

Bibliographic basis

Literature supporting the position.

  1. Howell J. D. Early clinical use of the X-ray. Transactions of the American Clinical and Climatological Association. 2016;127:341-349.
  2. Donald I.; MacVicar J.; Brown T. G. Investigation of abdominal masses by pulsed ultrasound. The Lancet. 1958;1(7032):1188-1195.
  3. Lahiri B. B. et al. Medical applications of infrared thermography: a review. Infrared Physics & Technology. 2012;55(4):221-235. DOI: 10.1016/j.infrared.2012.03.007.
  4. Fernández-Cuevas I. et al. Classification of factors influencing the use of infrared thermography in humans: a review. Infrared Physics & Technology. 2015;71:28-55. DOI: 10.1016/j.infrared.2015.02.007.
  5. Politi S. et al. Infrared thermography images acquisition for a technical perspective in screening and diagnostic processes: protocol standardized acquisition. Cureus. 2021;13(11):e19931. DOI: 10.7759/cureus.19931.
  6. Ribeiro J. A. S.; Giacomini L. A. Infrared thermography in biomedical and health-related research: a scientometric study based on Scopus and Web of Science (1980-2025). Quality & Quantity. 2026. DOI: 10.1007/s11135-026-02890-z.
Editorial authorship João Alberto S. Ribeiro CRM/SP 119.485