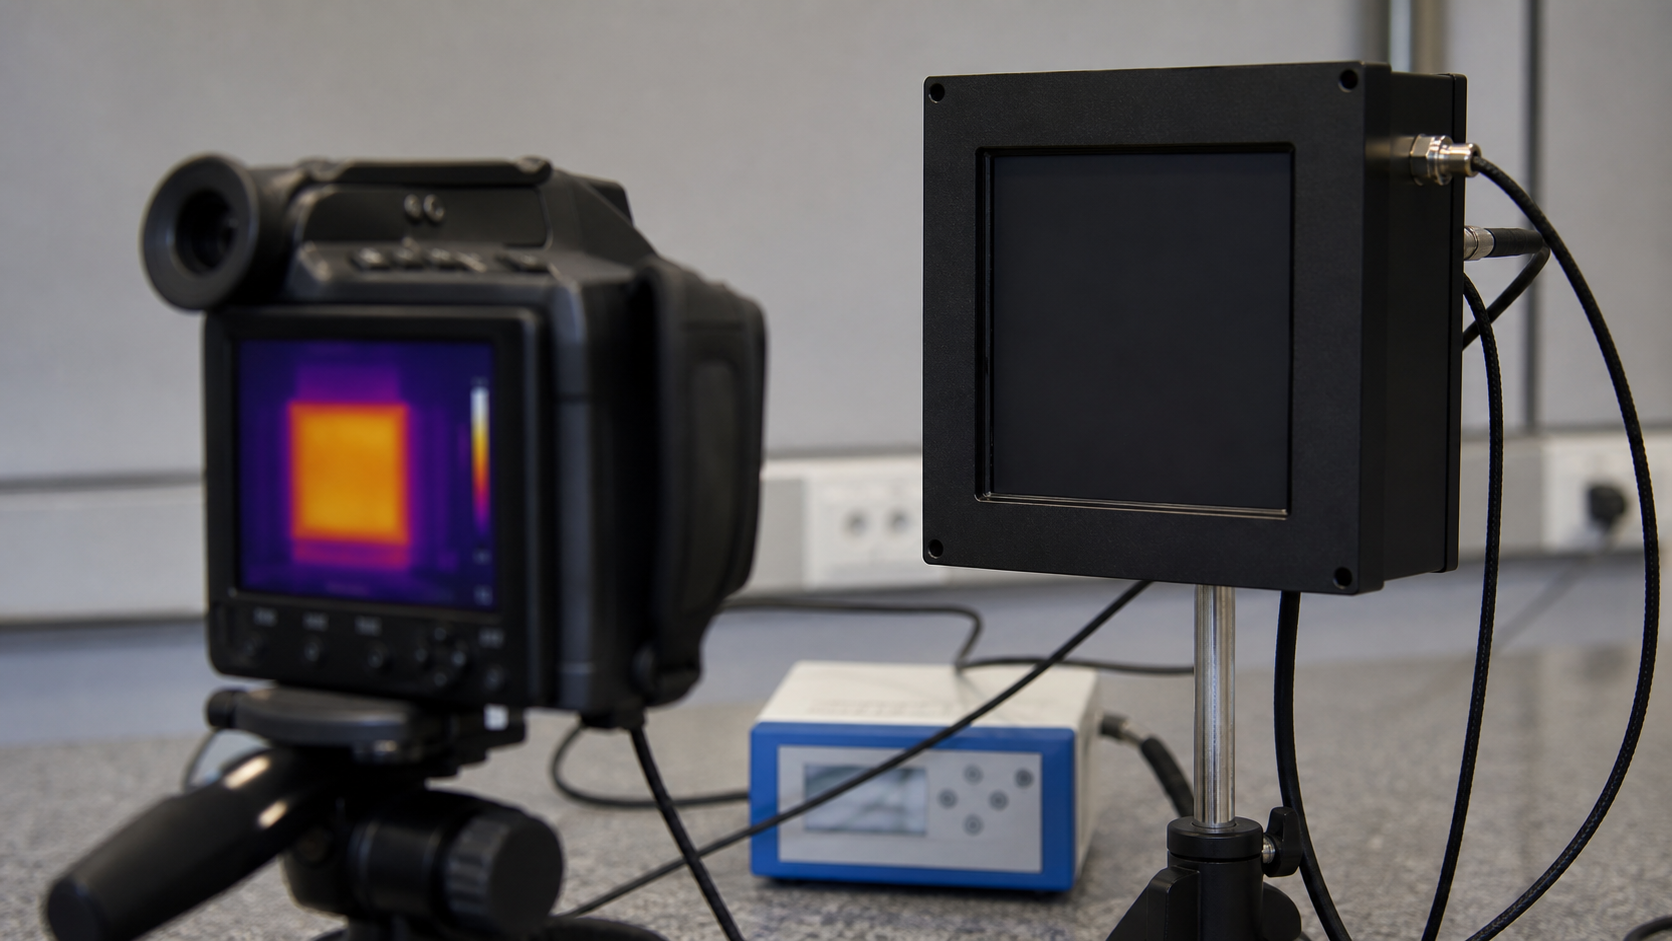
A thermogram is not originally a colored photograph. It begins as a matrix of radiometric signals: each point corresponds to the infrared energy that reached the detector from one viewing direction. The color palette comes later, as a way to make those values visible to the human eye.
What the camera actually detects
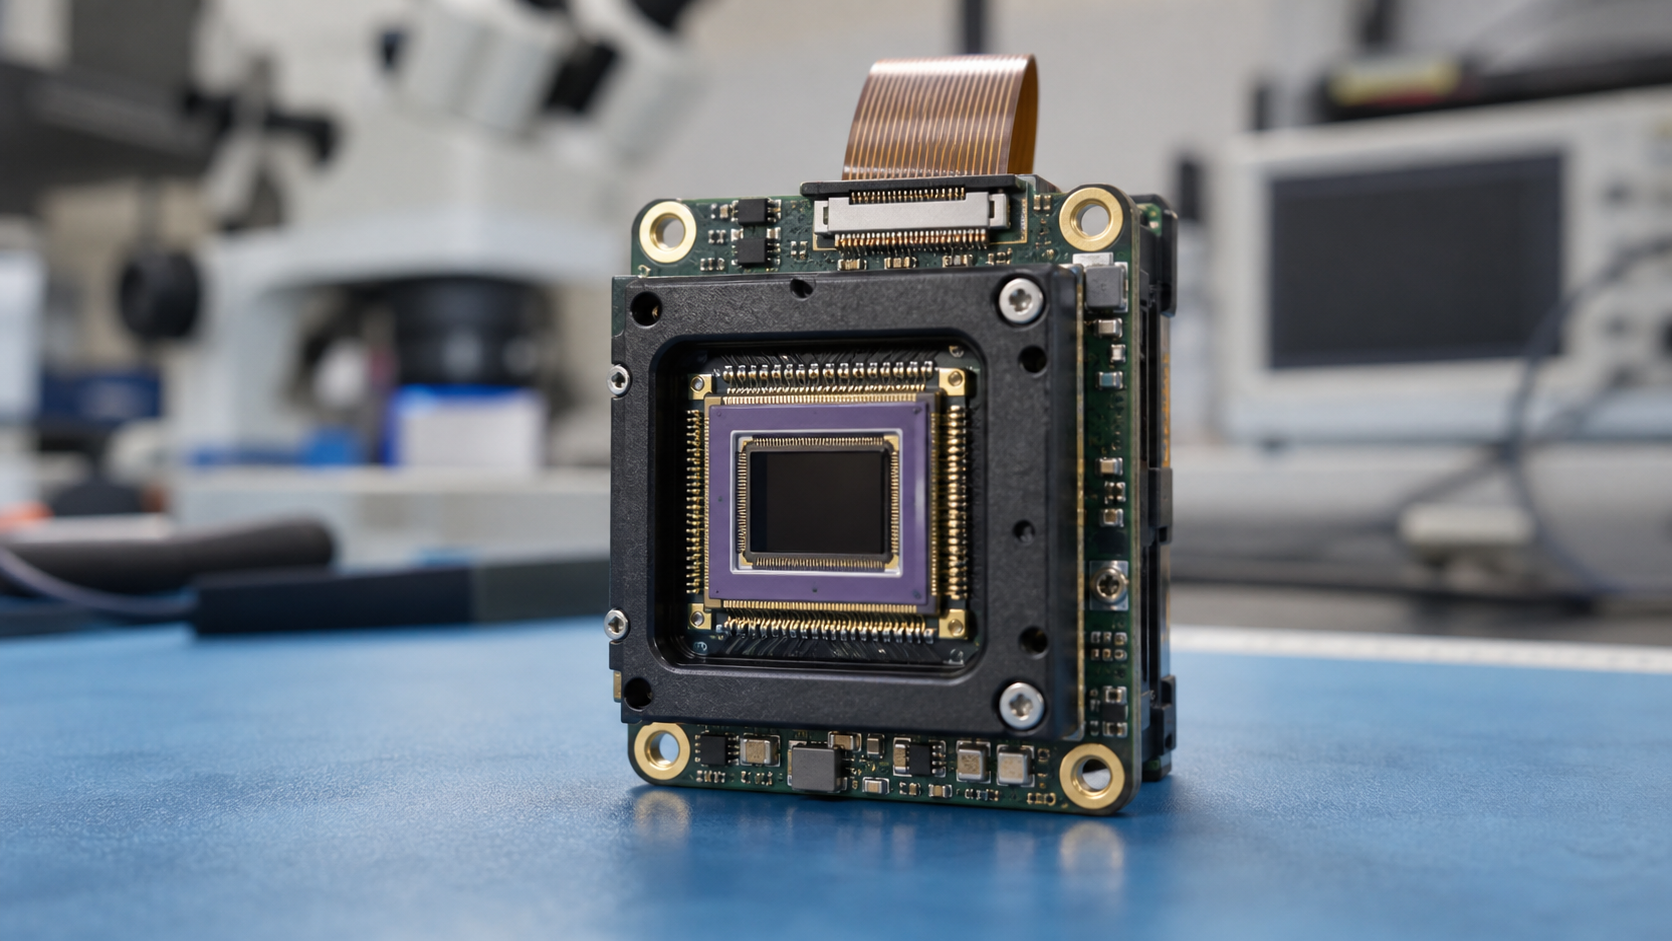
A thermal camera does not touch the skin and does not measure temperature like a contact thermometer. It receives infrared radiation emitted by the observed surface. That radiation crosses the lens, reaches the detector, and generates an electrical signal. The displayed temperature is an estimate calculated from that signal after physical corrections and internal calibrations.
In clinical practice, this difference matters greatly. The colored image facilitates visual reading, but the useful data is in the thermal matrix: values distributed in pixels, comparisons between regions, asymmetries, gradients, means, minimums, maximums, and thermal behavior under protocol.

Why it is called a bolometer
The term bolometer comes from the idea of measuring radiation. Historically, the bolometer was developed to detect very small variations in radiant energy. The principle remains elegant: a surface absorbs radiation, heats slightly, and that thermal change alters a measurable electrical property.
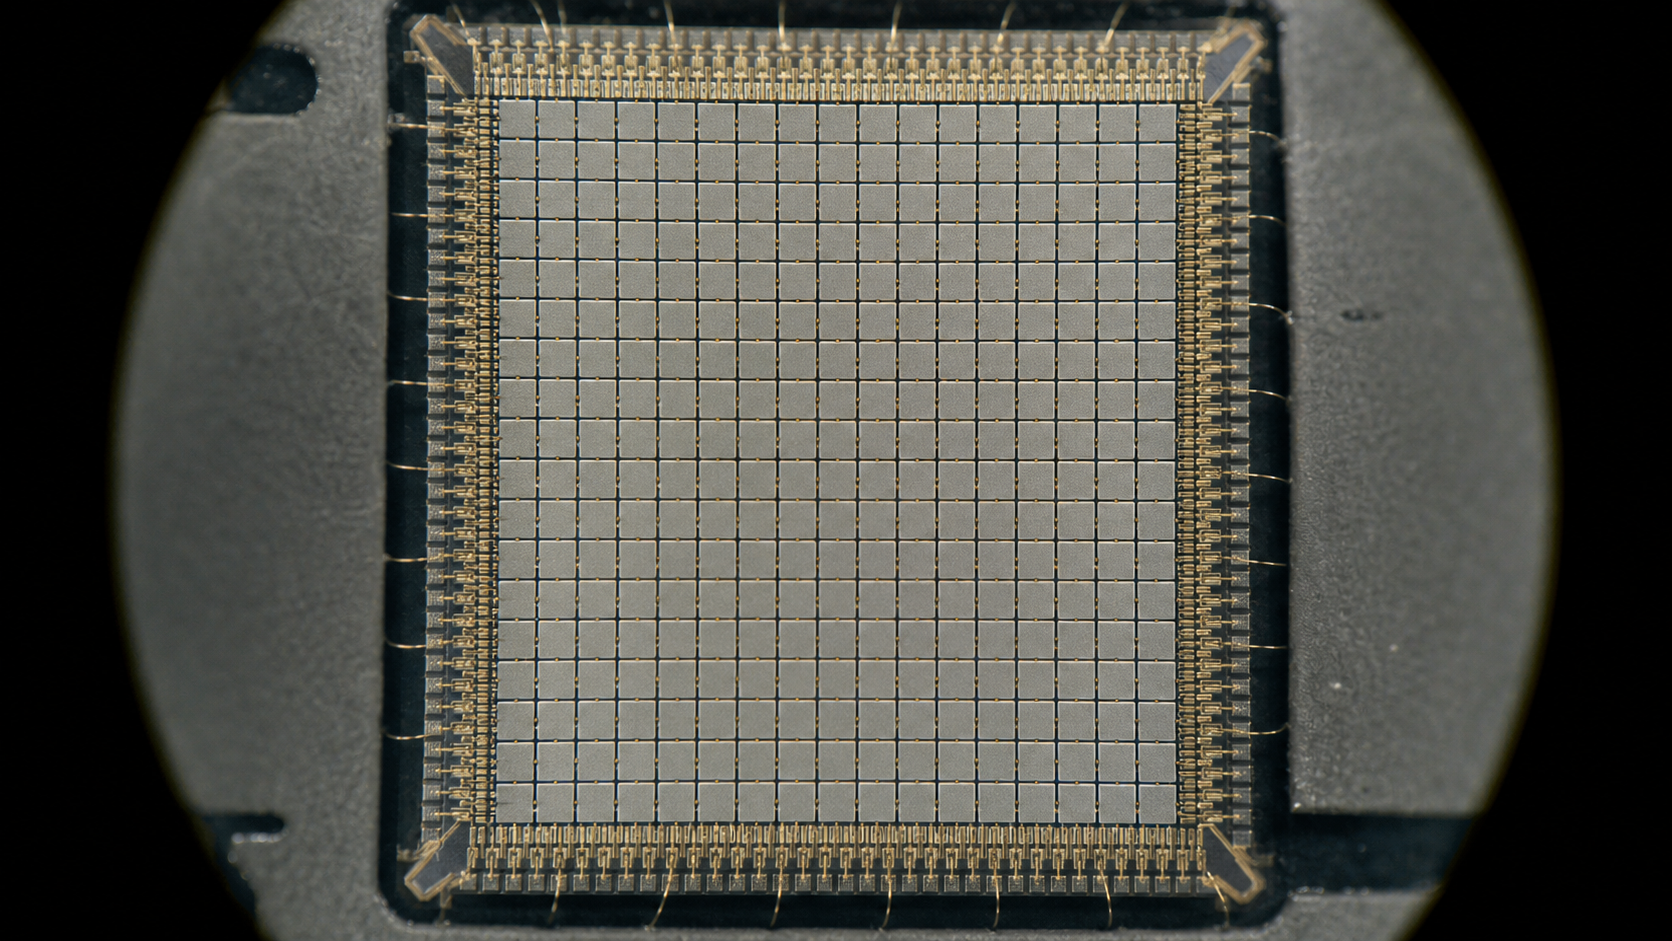
In the modern microbolometer, each pixel is usually a suspended microstructure. Infrared radiation is absorbed by a thin membrane. This membrane heats by a fraction of a degree and changes its electrical resistance. The readout circuit transforms this change into a digital signal. Then come non-uniformity corrections, noise compensation, internal reference calibration, and radiometric conversion.
The observed surface emits infrared energy as a function of its temperature and emissivity.
The lens projects this energy onto a matrix. Each pixel absorbs a small portion of the incident radiation.
The microbolometer membrane heats subtly. The sensor does not “see color”; it responds to energy.
The electrical resistance of the sensitive material changes. The circuit converts this variation into a signal.
The camera applies calibration, environmental compensation, and radiometric models to estimate temperature.
The mathematical bridge: Planck’s law and radiometric corrections
The physics behind the measurement comes from blackbody radiation. Planck’s law describes how an ideal body emits radiation as a function of absolute temperature and wavelength. A real camera does not use the pure equation in isolation; it integrates radiation over the detector spectral range, considers optical system response, and applies manufacturer calibration constants.
L(λ,T) = 2hc² / λ⁵ · 1 / (e^(hc/λkT) - 1)
This equation describes the spectral radiance of a blackbody. The camera uses calibrated and integrated versions of this principle to convert signal into apparent temperature.
The camera needs to know the measurement context
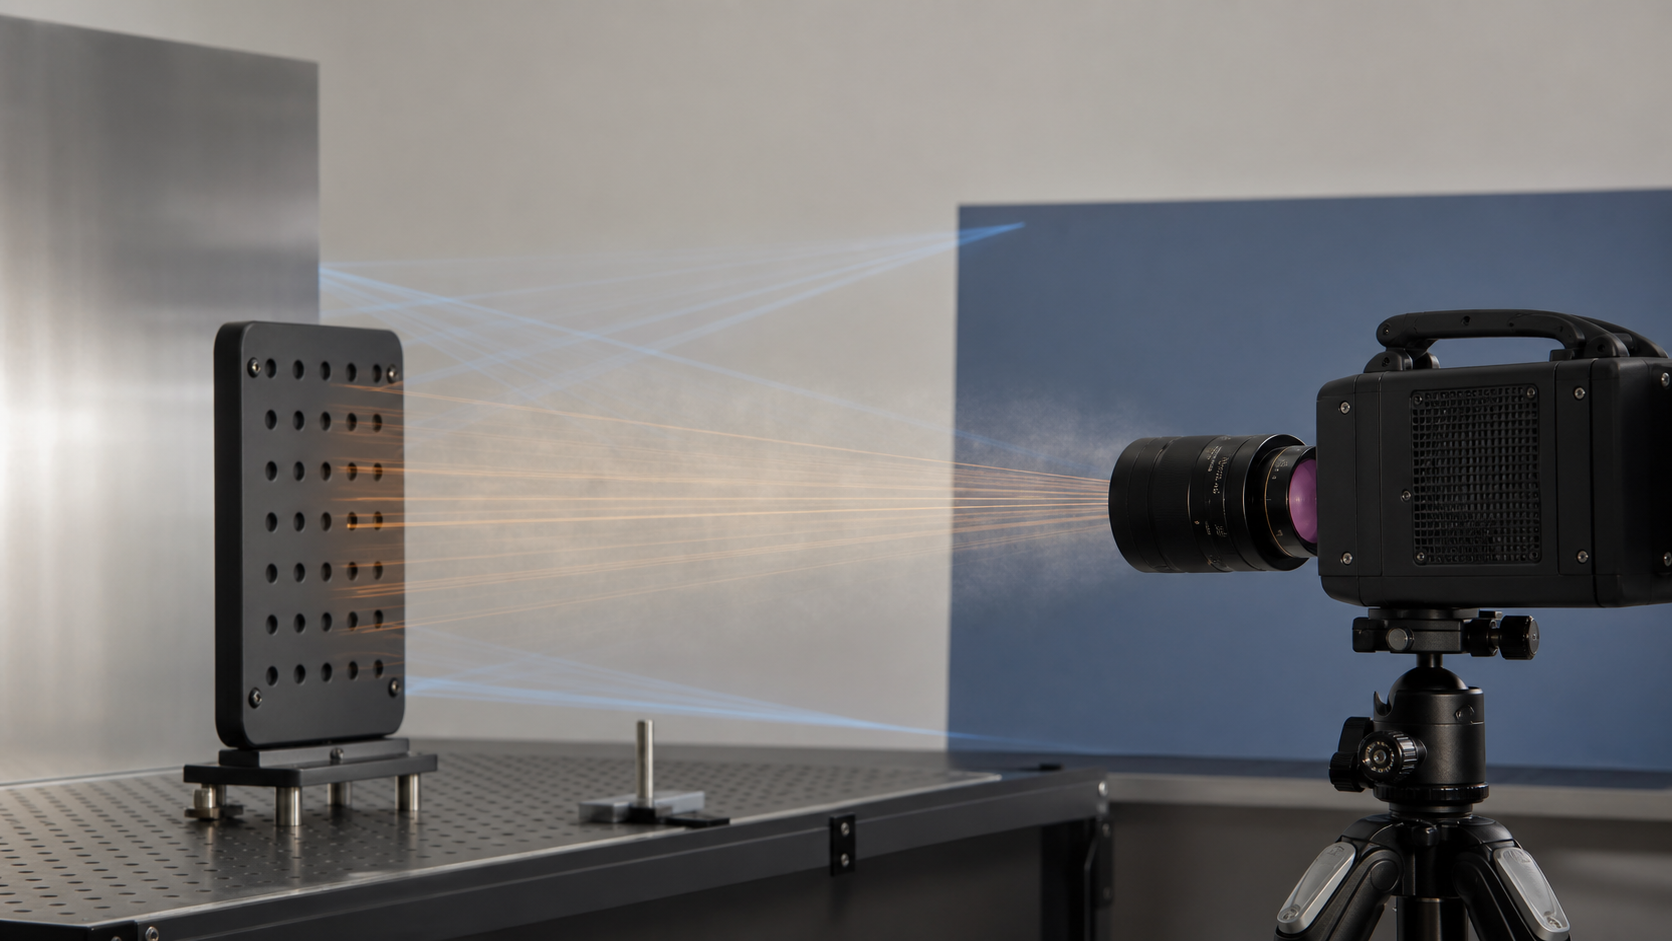
To estimate surface temperature, the camera does not consider only radiation leaving the object. It also needs to separate what was emitted by the surface, what was reflected from the environment, and what was added or attenuated by the atmosphere between the patient and the lens.
Lsensor = τ ε L(Tobj) + τ(1-ε)L(Trefl) + (1-τ)L(Tatm)
The signal received by the detector combines object emission, reflected ambient radiation, and atmospheric emission. Radiometric manufacturers use equivalent forms with their own calibration constants.
 τ ε L(Tobj)radiation emitted by the object
τ(1-ε)L(Trefl)reflected ambient radiation
(1-τ)L(Tatm)atmospheric attenuation and emission
τ ε L(Tobj)radiation emitted by the object
τ(1-ε)L(Trefl)reflected ambient radiation
(1-τ)L(Tatm)atmospheric attenuation and emission

The thermogram is a matrix before it is an image
When a camera has, for example, 640 × 480 pixels, it produces 307,200 reading points. Each point may store a radiometric value or an estimated temperature, depending on file format and software. The color palette transforms these values into an image understandable to the human eye.
For this reason, changing the color palette should not change the original thermal data. It changes the appearance. Adjusting the thermal window also changes how values are visually distributed. Serious radiometric software continues working with the matrix.
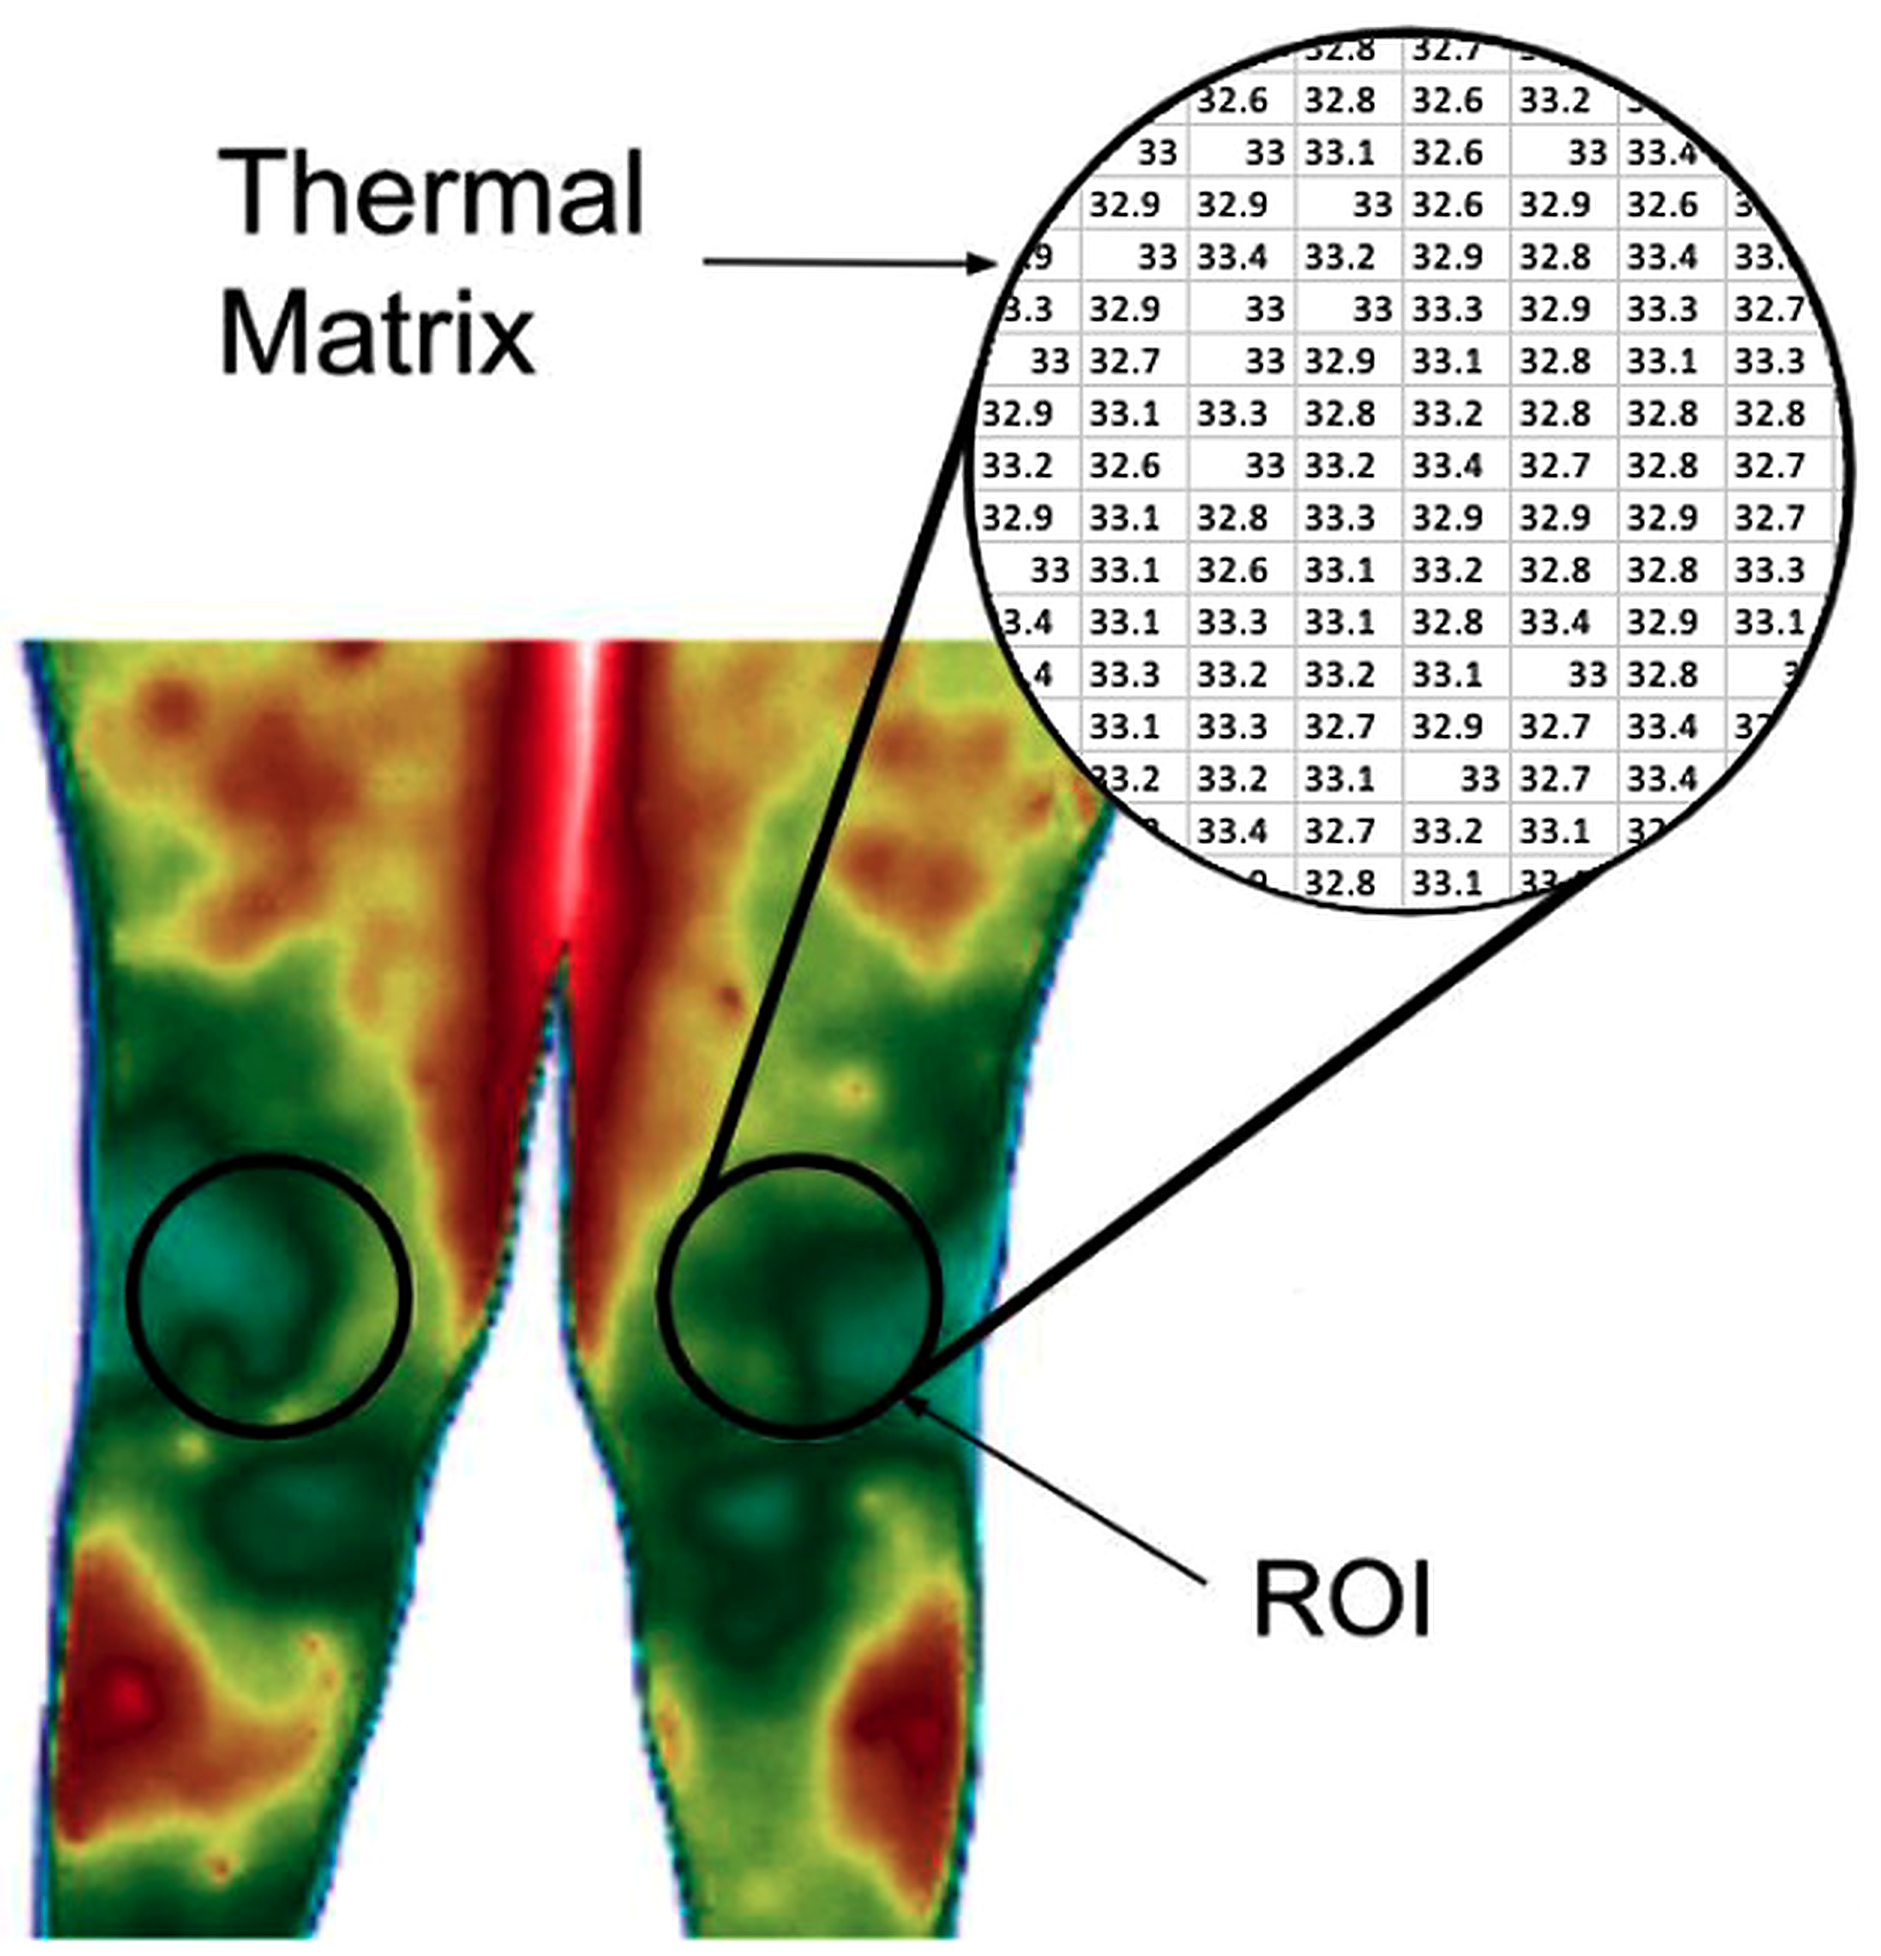

What the ROI fields are “seeing”
A circular ROI selects all pixels that fit inside that circle. The displayed mean is the sum of the temperatures of those pixels divided by the number of valid pixels. The minimum and maximum show the extremes inside the area. The thermal difference between Sp1 and Sp2 compares the means of the two regions.
This is why the interactive image on the home page invalidates the reading when the circle touches the white background. When part of the ROI leaves the body surface, the area no longer represents an anatomical region. The problem is not aesthetic; it is methodological.
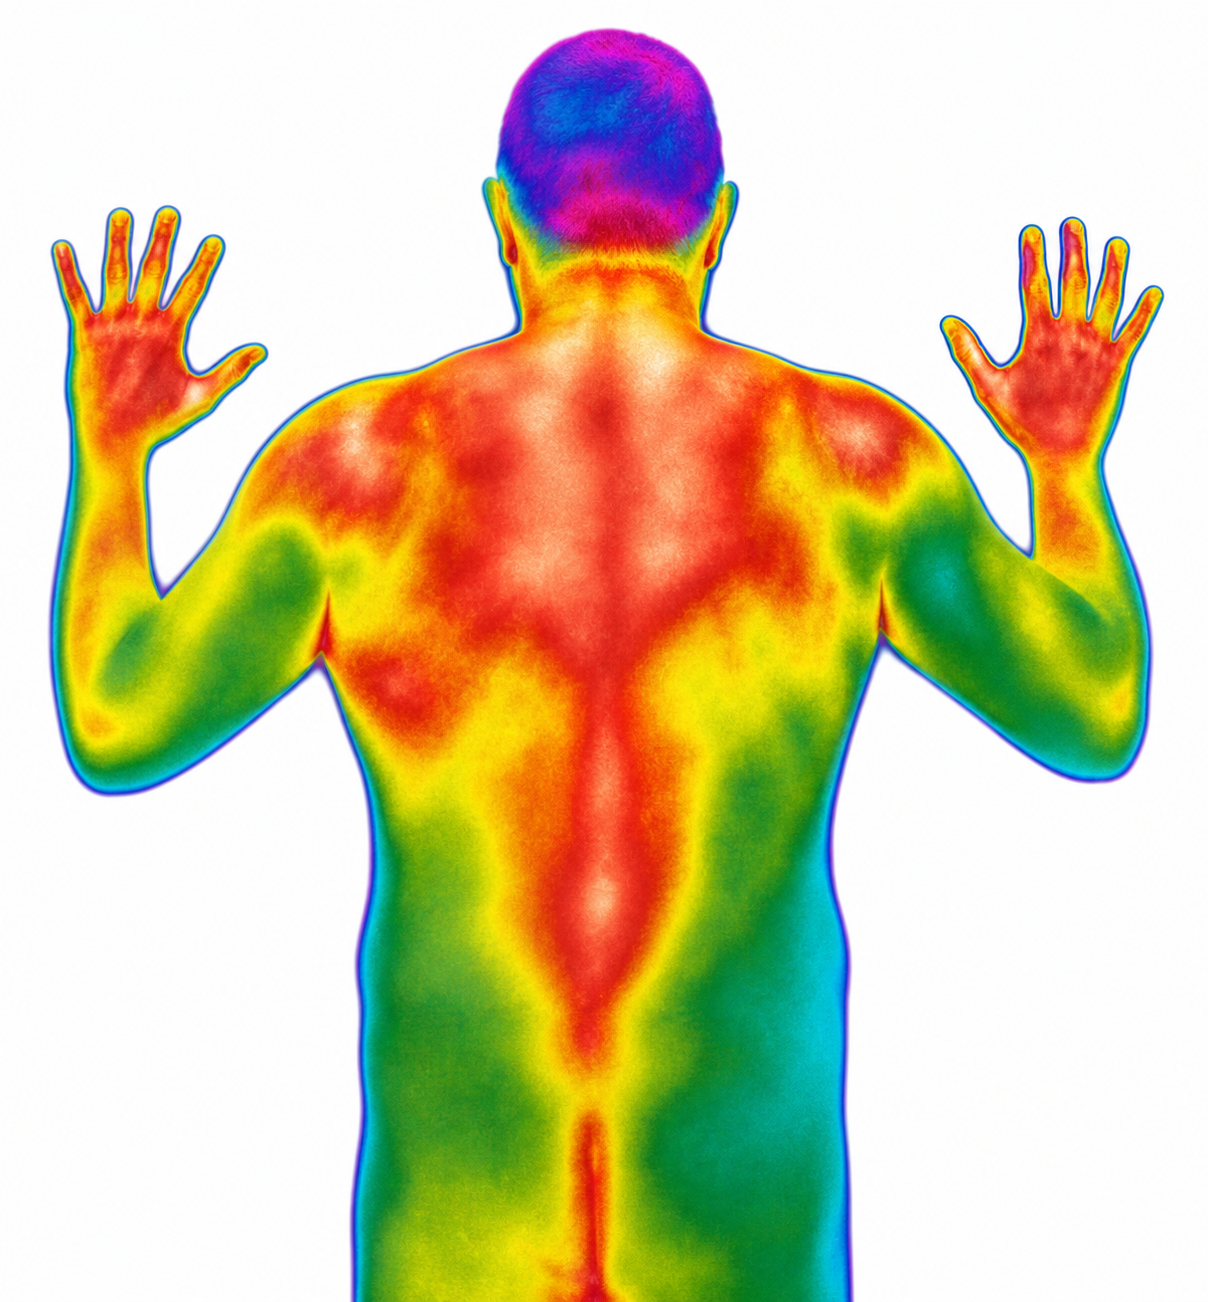
In medical thermography, color guides the eye. The matrix supports the analysis. The protocol gives clinical meaning to the thermal finding.
Conceptual care changes clinical reading
A red area is not automatically inflammation. A blue area is not automatically ischemia. The palette is a visual translation. Interpretation requires clinical context, symmetry, physiology, environmental control, regional comparison, anatomical knowledge, and understanding of the thermal matrix.
This is the point that Revista Termodiagnose seeks to reinforce: medical thermology is not reduced to striking images. It depends on method, standardization, and functional reading. When well applied, it does not replace radiography, ultrasound, MRI, or laboratory tests. It adds a different layer: the thermal distribution of the body surface as measurable physiological information.
References and sources
Tattersall GJ. Infrared thermography: A non-invasive window into thermal physiology. Comparative Biochemistry and Physiology Part A: Molecular & Integrative Physiology. 2016;202:78-98. DOI: 10.1016/j.cbpa.2016.02.022. PMID: 26945597.
Ribeiro JAS et al. Chronic Pain and Joint Hypermobility: A Brief Diagnostic Review for Clinicians and the Potential Application of Infrared Thermography in Screening Hypermobile Inflamed Joints. Yale Journal of Biology and Medicine. 2024. PMCID: PMC11202108.
Teledyne FLIR. FLIR cameras - temperature measurement formula. Technical document on emissivity, atmospheric transmission, reflected radiation, and radiometric conversion. Available at: flir.custhelp.com.
NASA Science. Infrared Waves. Reference material on infrared radiation in the electromagnetic spectrum. Available at: science.nasa.gov.