A commented analysis of the article published in Yale Journal of Biology and Medicine on chronic pain, joint hypermobility, and the potential role of infrared thermography in screening inflamed hypermobile joints.
Chronic Pain and Joint Hypermobility
Ribeiro JAS, Gomes G, Aldred A, Desuó IC, Giacomini LA. The Yale Journal of Biology and Medicine. 2024;97(2):225-238.
Joint hypermobility often enters clinical life through a narrow door: recurrent pain, instability, fatigue, autonomic complaints, gastrointestinal symptoms, inconclusive structural exams, and often a long sequence of consultations that cannot connect the whole picture. The article starts from this scenario to discuss a practical question: when a hypermobile joint hurts, is it only mechanical overload, is there subclinical inflammation, is there a neuropathic component, or is there a combination of these layers?
The answer is not simple, and that is precisely the value of the study. Infrared thermography enters as a complementary functional layer: it records the thermal distribution of the body surface and helps formulate hypotheses about microcirculation, inflammation, and local dysfunction, always together with history, physical examination, diagnostic criteria, and other imaging methods.
The problem
Patients with HSD or hEDS may spend years moving among diagnostic hypotheses, persistent pain, and tests without sufficient anatomical explanation.
The functional hypothesis
Thermal maps may help observe patterns of asymmetry, dysfunction, and possible subclinical joint inflammation.
Methodological care
Pain and heat are not synonyms. Thermological reading must separate nociceptive, neuropathic, and nociplastic components.
Hypermobility: when flexibility stops being just flexibility
The article revisits the difference between asymptomatic joint hypermobility, hypermobility spectrum disorders, and hypermobile Ehlers-Danlos syndrome. This distinction matters because a person may be more flexible without being ill; on the other hand, pain, instability, dysautonomia, fatigue, headache, pelvic symptoms, and gastrointestinal symptoms may occur within a systemic condition that deserves recognition in its own right.
Chronic pain: three layers that may overlap
One of the central ideas of the text is that pain in hypermobility-related syndromes should not be read as a single phenomenon. Repeated microtrauma, biomechanical overload, central sensitization, neuropathic pain, and nociplastic pain may coexist over the natural history. This helps explain why some patients report intense pain without evident proportional thermal correspondence, while others may show thermal changes in less symptomatic regions.
Tissue injury, overload, sprain, tendinopathy, or local inflammatory process.
Dysfunction of small fibers and sensory pathways carrying pain, temperature, and autonomic signals.
Altered pain processing even without proportional tissue damage or demonstrable nerve injury.
Where thermography fits
Infrared thermography appears in the study as a functional observation method. The camera records infrared radiation emitted by the body surface and transforms it into thermal data. In joints, this information may suggest changes in heat distribution associated with inflammation, microcirculation, or local thermal dysfunction.
The article also situates two historical models of thermological analysis in joints: the Thermographic Index, described in the 1970s, and the Heat Distribution Index, later proposed to study thermal distribution in joint regions. This evolution shifts thermography from isolated visual observation to measurement: region of interest, thermal matrix, temperature distribution, and side-to-side comparison.
The case series: pain mapped, body measured
The clinical section of the article presents three women with refractory chronic musculoskeletal pain and findings compatible with joint hypermobility. Participants completed pain maps and were assessed with BS, 5PQ, clinical examination, and total-body infrared thermography. To compare the thermal matrices, the study extracted regions of interest at knee level and compared temperature distribution between the right and left sides.
History since adolescence, multiple specialties, pain aggravated by exertion, and report of extreme joint flexibility.
Persistent pain, paresthesias, neurological and rheumatologic investigation, previous fibromyalgia diagnosis, and complaint of cold hands and feet.
Pelvic pain since adolescence, perineal pain/proctalgia, polyarthralgia, endometriosis, and long musculoskeletal investigation.
A 16-year-old participant without knee pain, included for thermal comparison of the regions of interest.
What the thermal matrix of the knees suggests
The most interesting reading is not in looking for an isolated hot spot. It is in comparing the distribution of the data. In the panels below, each case brings two layers of the same finding together: on the left, the statistical distribution of temperatures extracted from the regions of interest; on the right, the thermogram showing where those regions were positioned.
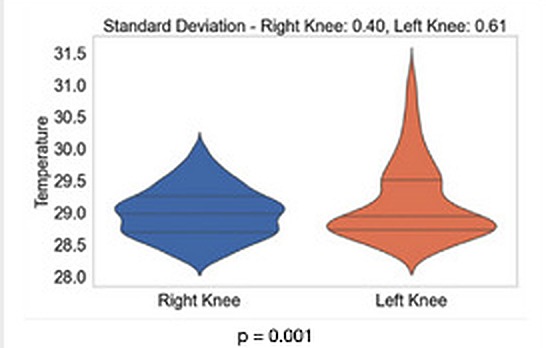
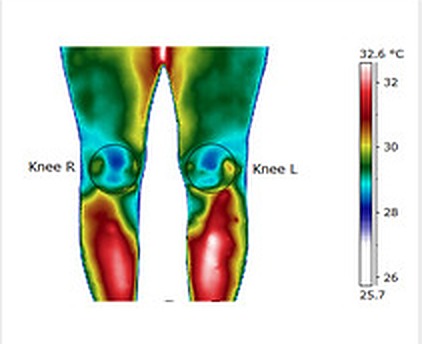
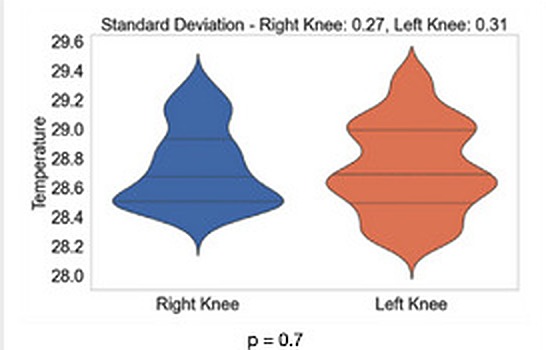
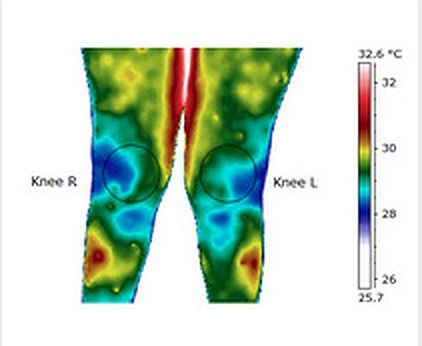
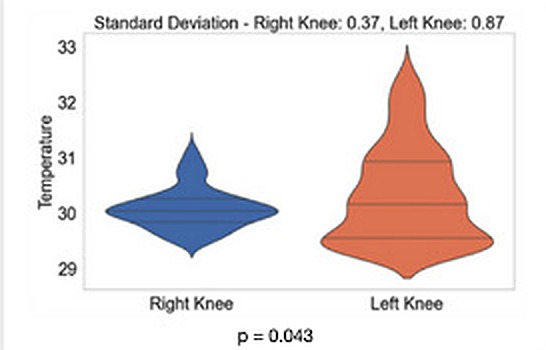
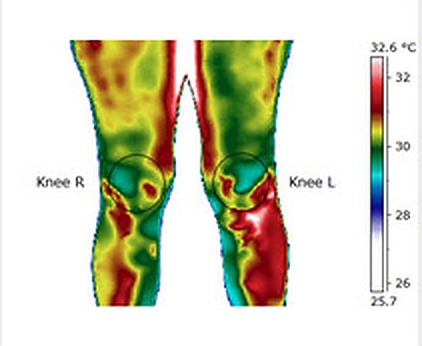
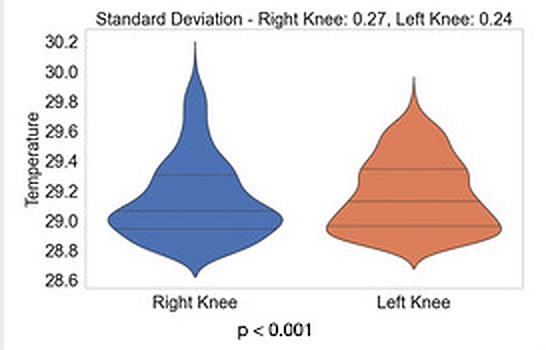
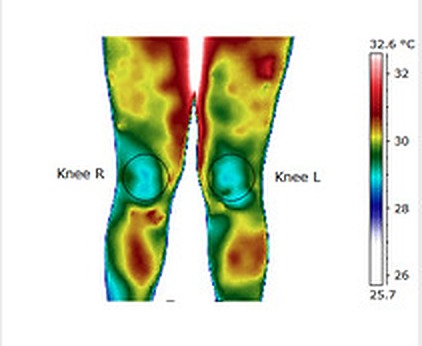
Panels adapted from Ribeiro JAS et al., Yale Journal of Biology and Medicine, 2024. A, B, and C correspond to participants with chronic pain and hypermobility; D corresponds to the control without knee pain.
These panels show why thermography should be read as a comparative matrix. Relevant information is not only in mean temperature, but in the shape of the distribution, dispersion of values, side-to-side symmetry, and relation to the pain map. In a patient with intense pain and little proportional thermal change, neuropathic or nociplastic mechanisms gain importance in the investigation. With thermal asymmetry, altered distribution, or loss of the expected gradient, inflammatory processes, microvascular dysfunction, or local overload deserve attention.
The contribution of thermography in this context is functional: observing how a region behaves thermally in light of clinical history, physical examination, and comparative data.
Why this article matters to the Institute
The study combines an underdiagnosed clinical issue with a methodological proposal: using thermography as a tool for screening and translational research in complex musculoskeletal pain. This speaks directly to the mission of Termodiagnose Institute Brazil: turning thermal imaging into analyzable data, with protocol, criteria, comparison, and interpretive prudence.
The proposed path is methodological: delimit hypotheses, apply standardization, extract data matrices, and study how pain, inflammation, microcirculation, and the nervous system may intersect in translational clinical practice.
Reference
Ribeiro JAS, Gomes G, Aldred A, Desuó IC, Giacomini LA. Chronic Pain and Joint Hypermobility: A Brief Diagnostic Review for Clinicians and the Potential Application of Infrared Thermography in Screening Hypermobile Inflamed Joints. Yale J Biol Med. 2024;97(2):225-238. DOI: 10.59249/WGRS1619. PMID: 38947102. PMCID: PMC11202108.
Commentary published by Termodiagnose Institute Brazil. Scientific authorship of the original study: João Alberto de Souza Ribeiro and collaborators.