The study by Korkmaz and colleagues observes amateur soccer players before and after a Wingate anaerobic test. Its strength lies in the time-series idea: thermography does not record only a before-and-after image, but follows how specific muscle regions change over minutes.
A short effort also leaves a thermal signature
The Wingate test is a 30-second maximal effort. It does not reproduce every soccer gesture, but it represents a decisive part of the game: sprints, accelerations, explosive actions, and short anaerobic demands.
In the study, the question was direct: after this effort, which lower-limb muscles show a measurable skin-temperature change? And which individual characteristics may modify this response?
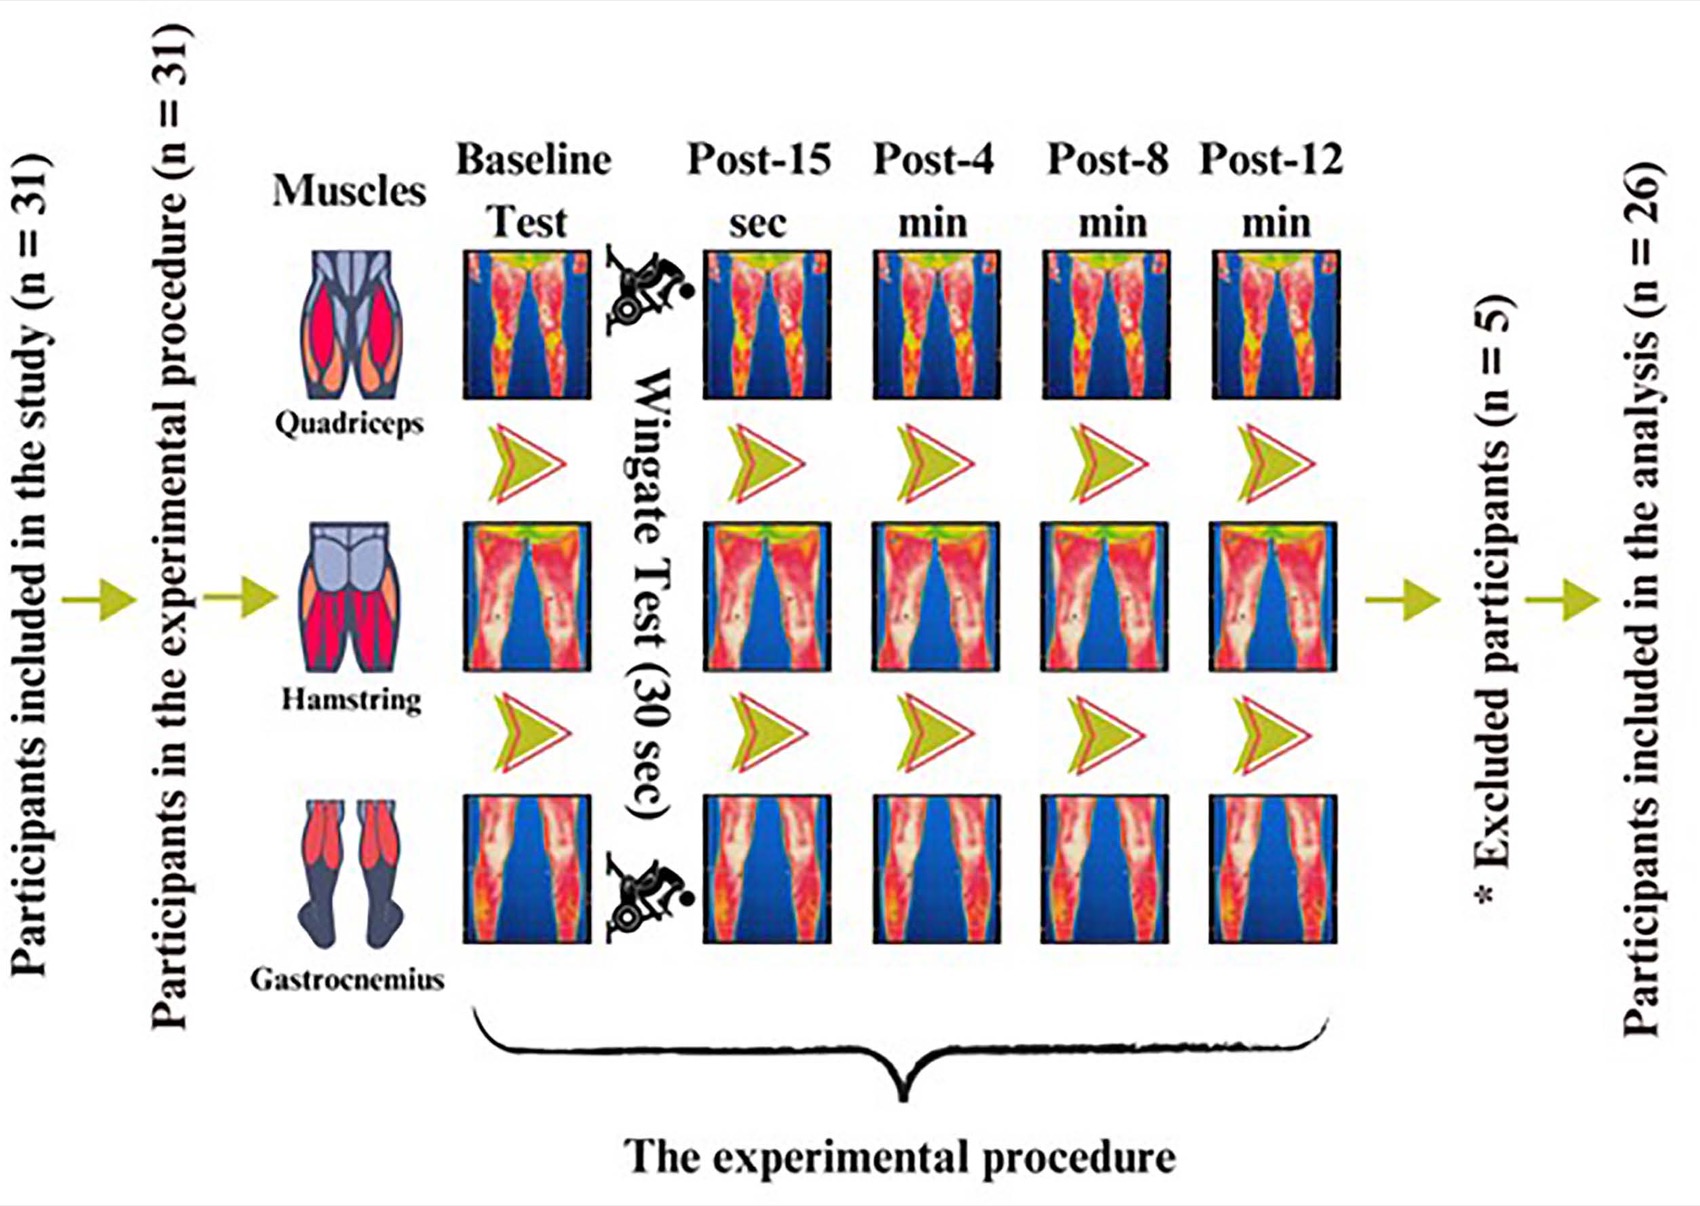
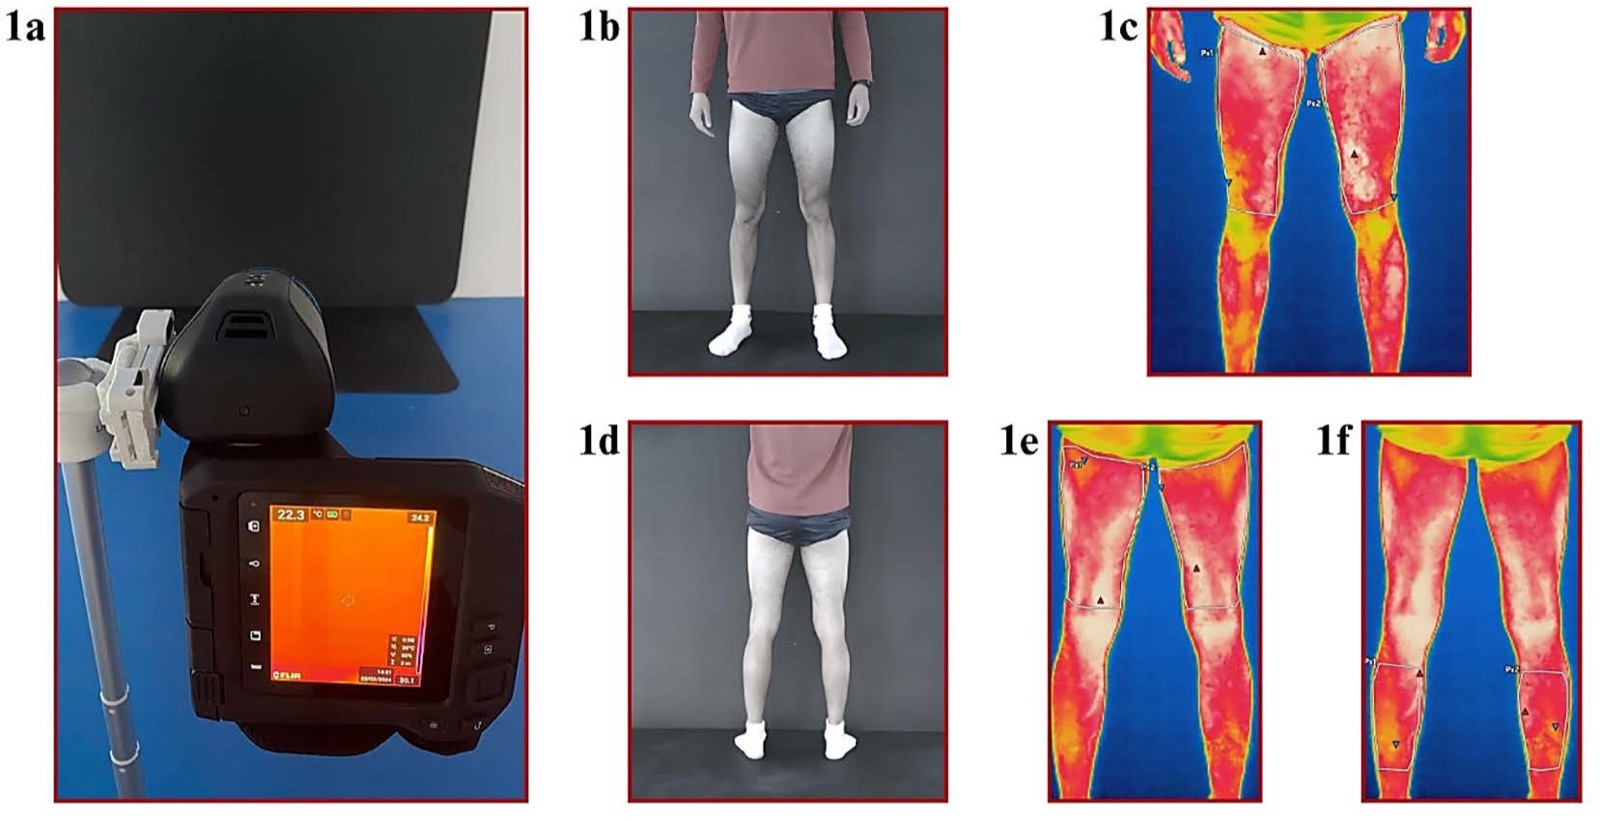
The study design followed recommendations for thermographic imaging in sports and exercise. The laboratory was maintained at 22 ± 2 °C, with humidity between 40 and 60%, without relevant air drafts. Athletes remained in acclimatization for 20 minutes, and images were acquired against a dark background.
- Baseline image before the test, after acclimatization
- Wingate 30 seconds of maximal effort on a cycle ergometer
- 15 seconds first immediate-response window
- 4 minutes initial phase of thermal redistribution
- 8 minutes intermediate follow-up of recovery
- 12 minutes window in which the right quadriceps stood out
Where to measure matters as much as when to measure
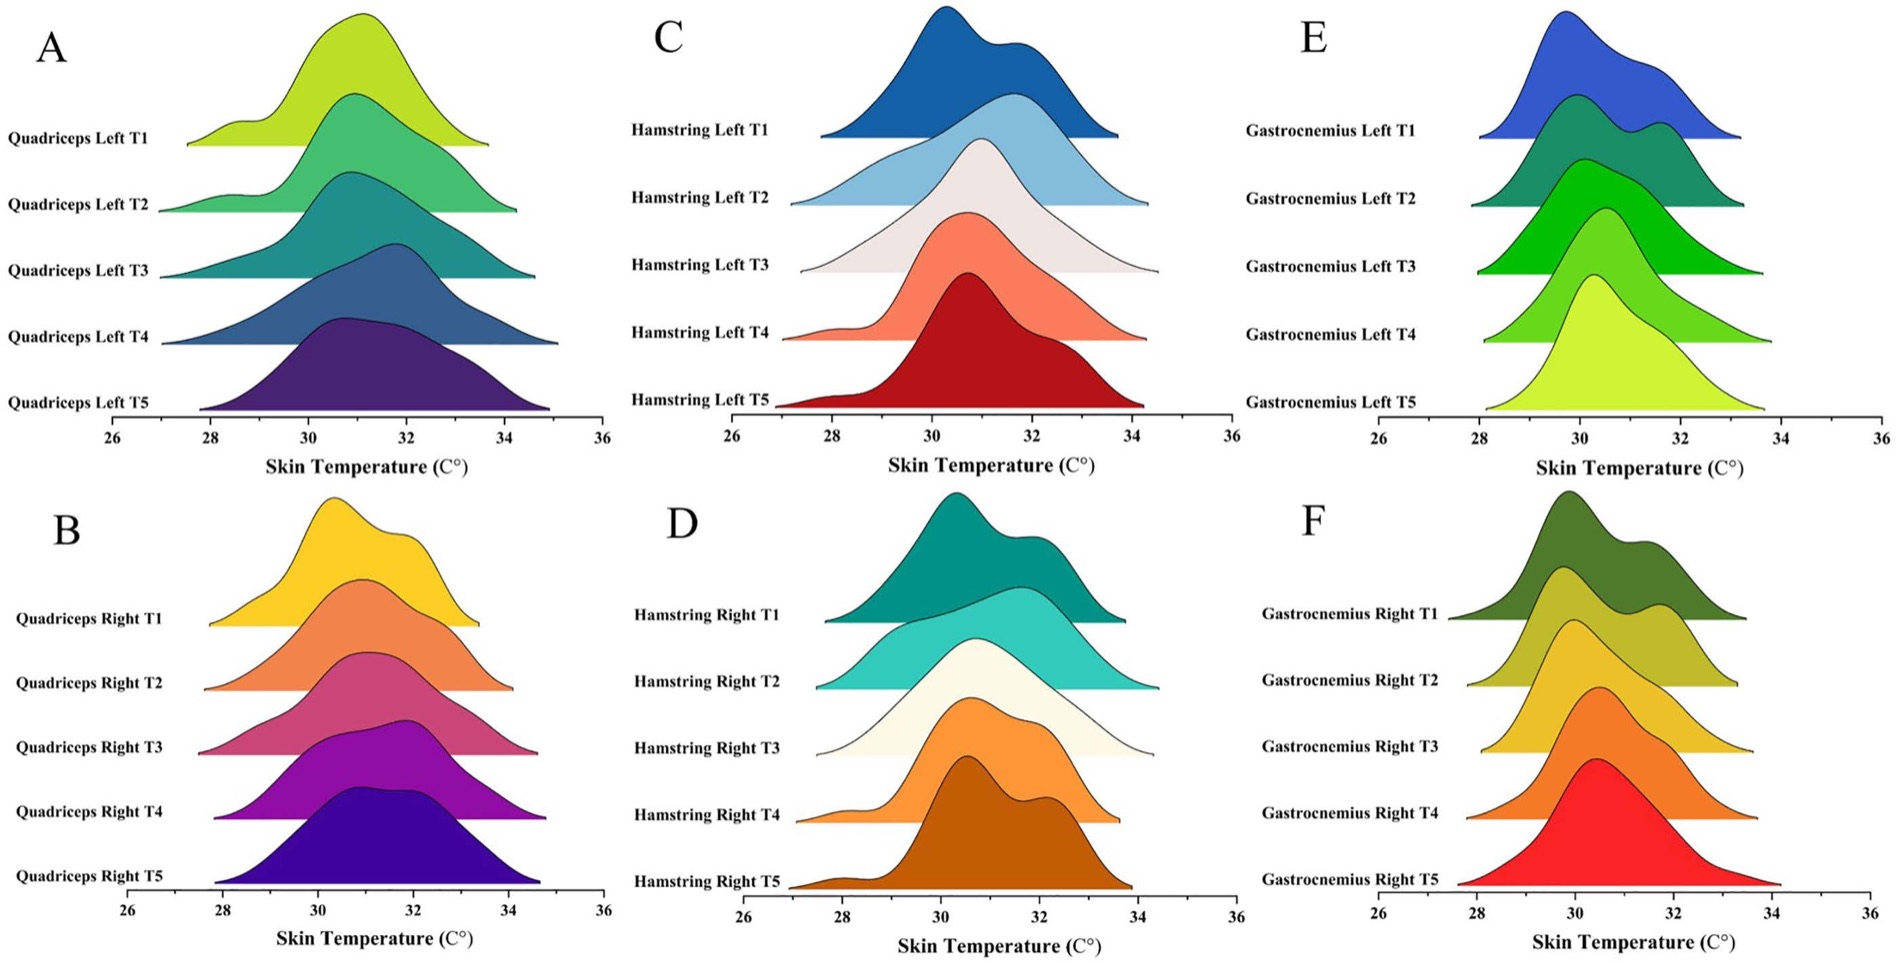
Regions of interest were manually drawn over quadriceps, hamstrings, and gastrocnemius muscles on both sides. The mean thermal value of each ROI entered the statistical analysis.
This preserves an essential principle: sports thermography must move from visual impression to regional measurement. Without ROI, the color palette may suggest more than it actually measures.
The main finding did not appear immediately
There was a significant effect of time, with increased skin temperature at 12 minutes compared with baseline.
No significant time effect was found in the main analyses.
Players with lower body-fat percentage showed greater thermal responses in quadriceps and hamstrings.
These variables did not show a consistent effect on thermal responses in the analyzed model.
Numbers that guide the reading
Why the time series changes interpretation
An acquisition immediately after exertion may miss part of the response. The study shows that the 12-minute window was decisive for the right quadriceps, suggesting that muscle thermal dynamics may lag behind the sports gesture.
In practice, this changes the question. It is not enough to know whether a region is warm. One must know when it warms, how long it remains altered, and whether this behavior repeats in the same athlete.
What this teaches about thermography in sports
Thermography may help follow the functional response of muscle groups after intense loads.
A single image does not replace history, symptoms, recent load, performance, and physical examination.
Body-fat percentage may modulate skin temperature and needs to enter interpretation.
Sweating, environment, acclimatization, and positioning can invalidate or weaken the image.
Methodological care prevents rushed conclusions
The study was conducted with male amateur players, with a final sample of 26 participants. The thermal response was acute, restricted to 12 minutes after the Wingate test, and did not include invasive physiological markers such as lactate or inflammatory cytokines.
Even so, the article is valuable because it shows a methodological direction: thermography in sports should be repeated over time, analyzed by ROI, and interpreted with biological moderators. Skin heat is functional data, but it is not an isolated diagnosis of fatigue, microtrauma, or injury risk.
In sports, the most useful thermogram may not be the most beautiful one. It is the one that allows the same athlete, the same region, and the same load to be compared at defined moments.
Main reference
Korkmaz S, Thapa RK, Relph N, Çalık İ, Uysal HŞ. Thermal imaging responses of lower-limb muscles following anaerobic testing in male soccer players: A time-series approach. PLoS One. 2025;20(10):e0331102. doi:10.1371/journal.pone.0331102.
Editorial commentary published by the Termodiagnose Journal. The text summarizes the study for educational purposes and preserves the distinction between functional monitoring, physiological hypothesis, and clinical decision-making.